. 2023 Jun 23;5(15):3803–3833. doi: 10.1039/d3na00319a

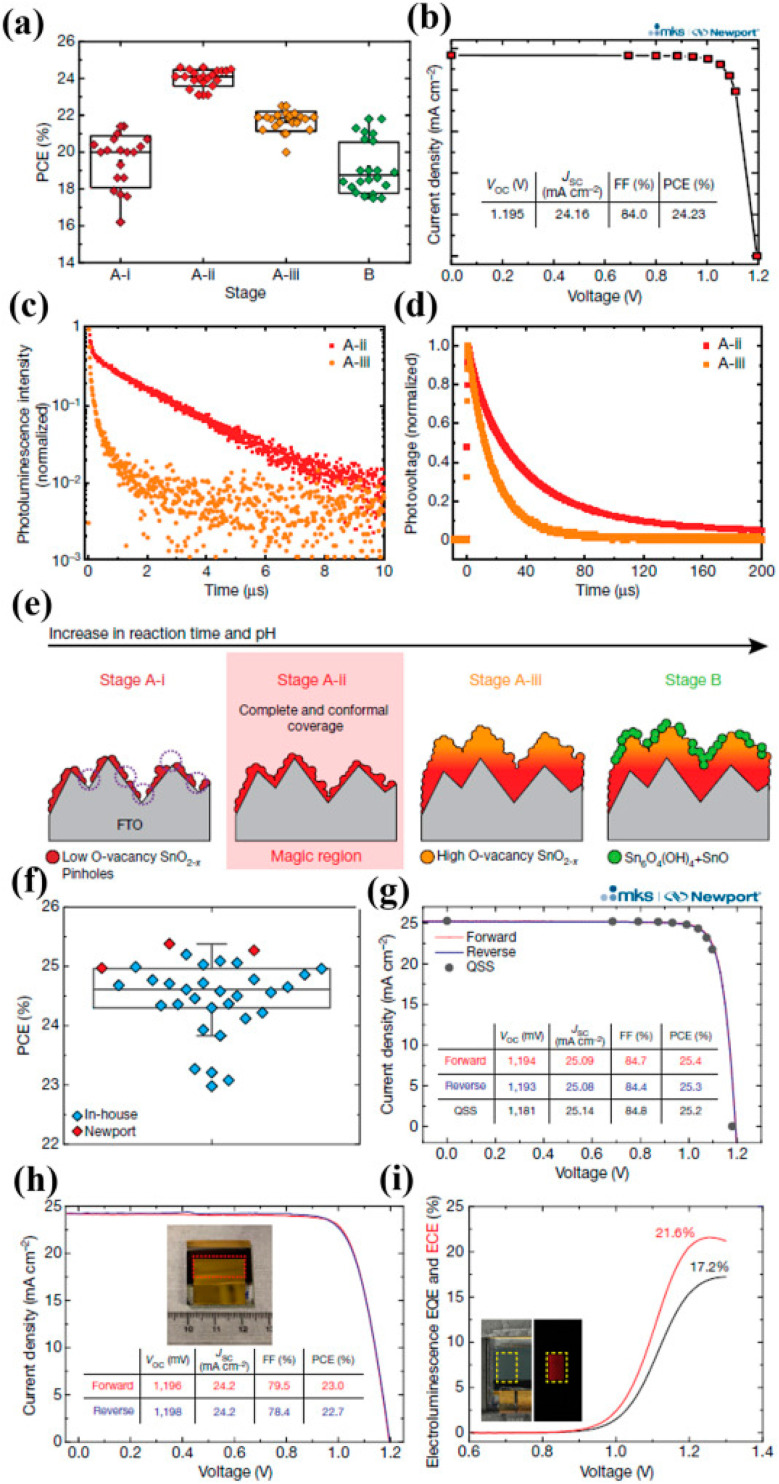
Fig. 15. (a) The difference in PCE of PSCs together with alteration in SnO2 preparation phases. (b) Quasi-steady-state current density vs. voltage characteristic for stages A-ii. (c) Time-resolved photoluminescence study for perovskite absorber set for the stage A-ii (red trace), stage A-iii (orange trace) of SnO2 ETL. (d) Transient photovoltage study for stage A-ii and stage A-iii, SnO2-based PSCs. (e) The development stage of SnO2 ETL. (f) Statistical spreading depiction in box-and-whisker plots for established PSCs. (g) JV curves of the produced PSCs obtained at Newport. (h) JV curve displaying supreme PCE of 23% under the active area of 0.984 cm2. (i) Electroluminescence EQE and ECE findings of PSC under forwarding bias (reproduced with permission from ref. 151. Copyright 2021 NPG).

Fig. 15