. 2023 Jul 4;5(15):3942–3954. doi: 10.1039/d3na00032j

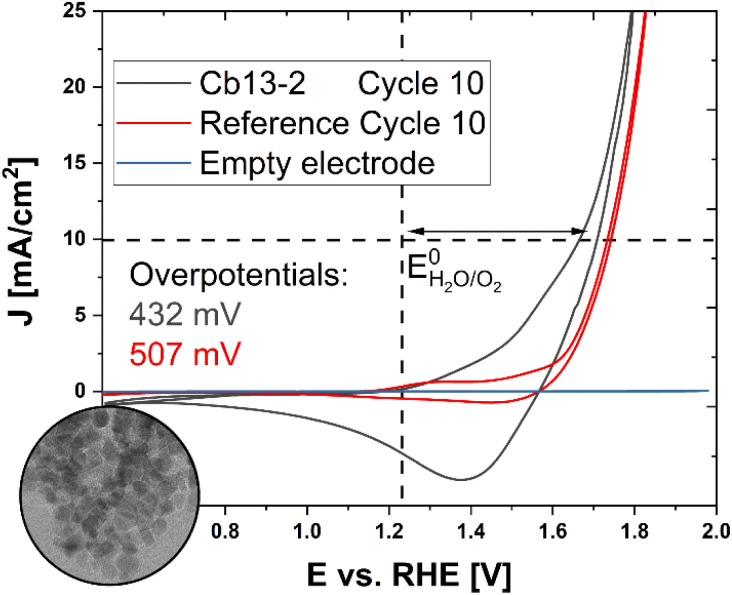
Fig. 6. Electrochemical characterization and OER performance of ligand-free cuboidal NPs. Inset: TEM micrograph of non-stabilized NPs (Cb13-2). The complete TEM micrograph is displayed in Fig. S15. Cyclic voltammograms of synthetic NPs (black curve) in comparison to a commercial Co3O4 nanopowder (red curve). Both samples were cycled 10 times at a scan rate of 50 mV s−1. The blue trace shows the electrochemical response of a bare glassy carbon RDE. The vertical dashed line indicates the position of EH2O/O20 and the horizontal dashed line marks the current density of J = 10 mA cm−2 at which the overpotentials ηi = 10 mA cm−2 were determined.

Fig. 6