. 2023 Jun 19;5(15):3862–3870. doi: 10.1039/d3na00335c

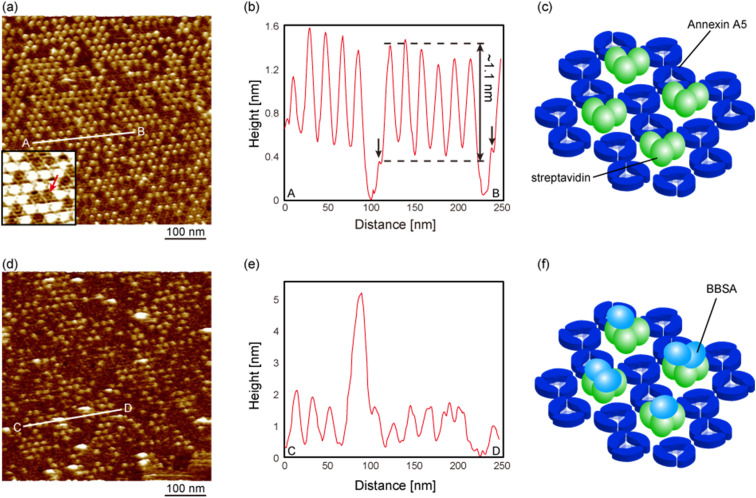
Fig. 5. FM-AFM images of the streptavidin (SA) nanoarray interacting with biotinylated bovine serum albumin (BBSA). (a) Topographic image of the SA nanoarray using the 2D annexin A5 crystal after adding streptavidin molecules. Inset shows a magnified image of the SA nanoarray. As shown by the red arrow, the annexin A5 trimers were observed in the vacancies of the SA nanoarray. (b) Cross-sectional profile of the line A–B in (a). (c) Schematic model of the SA nanoarray using the 2D annexin A5 crystal. (d) Topographic image of the SA nanoarray after dropping BBSA molecules. (e) Cross-sectional profile of the line C–D in (d). (f) Schematic model of the SA nanoarray binding BBSA molecules. The imaging solution was 10 mM MES-K buffer solution containing 150 mM NaCl and 10 mM CaCl2 (pH 6.0).

Fig. 5