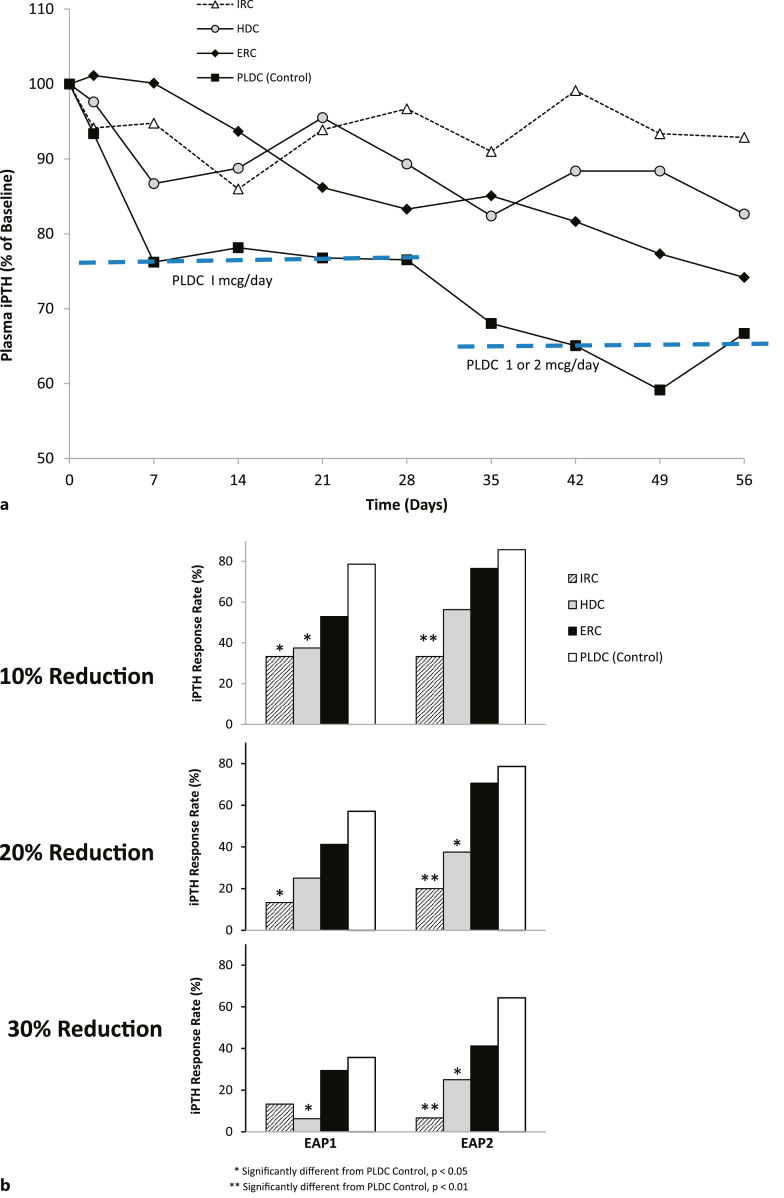
Fig. 3.
a Time courses of changes in plasma iPTH levels. Mean serum total plasma iPTH levels (% of baseline) in the four treatment groups were plotted using available time point data, from the start to end of treatment. b Plasma iPTH response rates. Three different thresholds were used to assess iPTH-lowering response rates: ≥10%, ≥20%, and ≥30% reductions from baseline at EAP1 and at EAP2. Significant differences from the PLDC (reference) group are as indicated.

