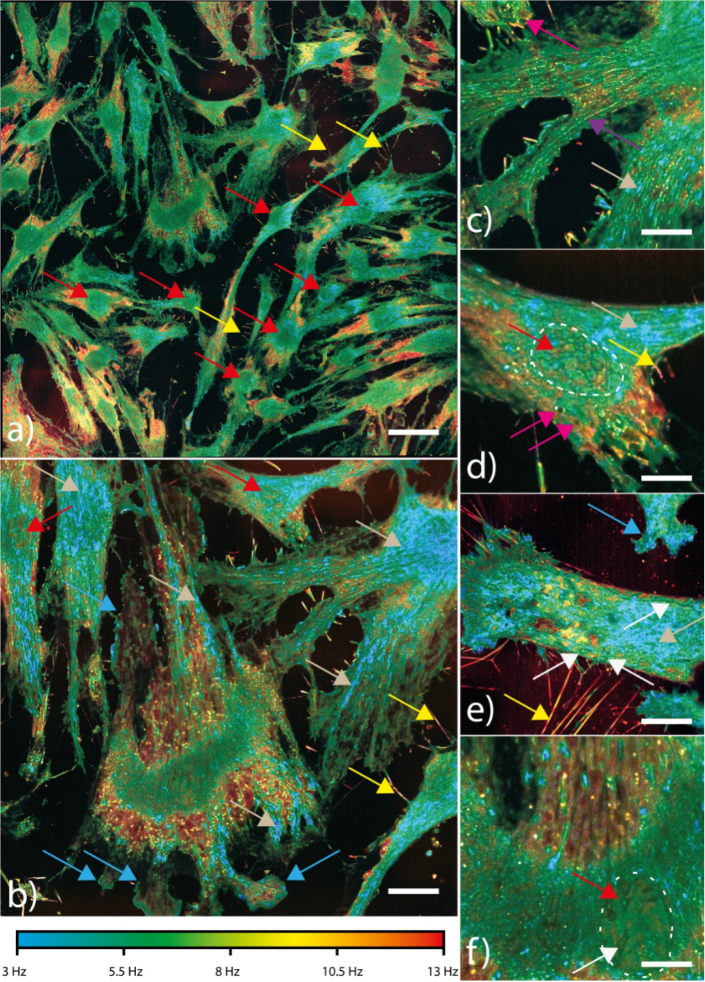
Fig. 5.
Fibroblast structural analysis using iSR D-FFOCT. Fig.5a shows an iSR D-FFOCT HSB mosaic of fibroblasts composed of 5 × 5 tiles with 20% overlap. Hue scales from 3 to 13 Hz. Examples of nuclei observed are highlighted by red arrows in Fig.5a. Fig.5b highlights cases of lamellipodia structures (blue arrows). Fig.5c shows actin fibres, one example highlighted with a purple arrow. Euchromatin structures can be observed in Fig.5d within the nucleus, delimited by a white dashed line. Sharp membrane ridges and curved membrane pockets (white arrows) are shown in Fig.5e, as well as ridges in a nucleus in Fig.5f, delimited by a white dashed line. Examples of static organelles are highlighted by pink arrows in Fig.5c-d. Slowly varying stress fibers (blue filaments shown by grey arrows) are also visible. An example of a filipodium is highlighted in Fig.5e with a yellow arrow. Scale bar is 90 µm for Fig.5a, 40 µm for Fig.5b, 20 µm for Fig.5c, 15 µm for Fig.5d, 30 µm for Fig.5e and 15 µm for Fig.5f

