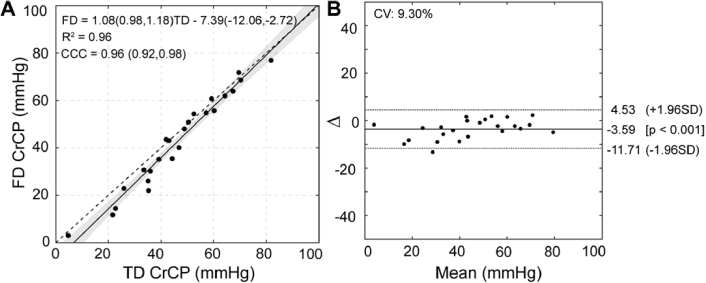
Fig. 4.
Relationship between frequency and time-domain estimates of critical closing pressure (CrCP) in 24 subjects. (A) A significant linear relationship between time domain (TD) vs. frequency domain (FD) CrCP (R2 = 0.96, p < 0.001). Solid black line represents the model fit with 95% confidence intervals shaded. Dashed black line is the line of unity. Model slope and intercept coefficients are given with 95% confidence bounds. R2 = coefficient of determination, CCC = Lin’s concordance correlation coefficient (95% CI). (B) Bland-Altman plot of the TD/FD CrCP agreement. Solid line represents mean difference, dotted lines show limits of agreement given as 1.96 standard deviation (SD). CV = coefficient of variation = SD/mean.

