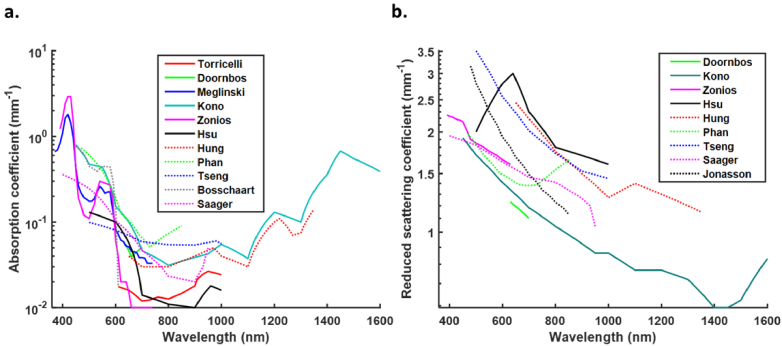
Fig. 8.
Variability in absorption coefficients (a) and reduced scattering coefficients (b) amongst the published in-vivo data. For readability the data is plotted by linear interpolation of the available data points. Note that Kono et al., measured scattering coefficients which were converted to reduced scattering coefficients for the purpose of this graph using the equation µ’s = µs(1-g) and g = 0.84 (the average anisotropy coefficient amongst all the published papers used in this review).

