. 2023 May 31;11(15):5287–5300. doi: 10.1039/d2bm02022j

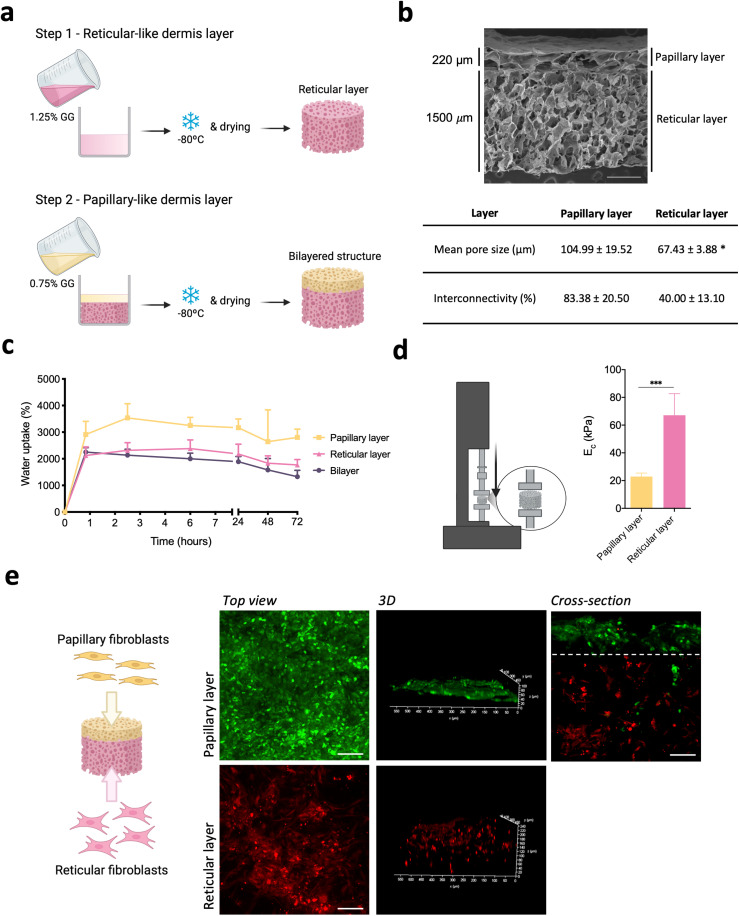
Fig. 3. Bilayer structure preparation and characterization. (a) Schematic representation of the fabrication of the bilayer gellan gum (GG) structure. (b) Representative SEM micrograph of the bilayer dried polymeric structure and respective mean pore size and interconnectivity obtained by μ-CT analysis. Scale bar = 500 μm. (c) Water uptake ability of the bilayer structure and of the respective layers when processed independently. (d) Schematic representation of the compressive test and respective compressive modulus (Ec) values of the respective layers when processed independently without cells. (e) Schematic representation of the seeding of the subpopulations of fibroblasts in the different layers of the bilayered structure and representative images of papillary (green, Cell Tracker™ Green CMFDA) and reticular fibroblasts (red, Cell Tracker™ Orange CMRA) after 3 days of culture. Scale bar = 100 μm. Quantitative results are expressed as the mean ± standard deviation where n = 5, *p < 0.05, ***p < 0.001, two-tailed unpaired t-test.

Fig. 3