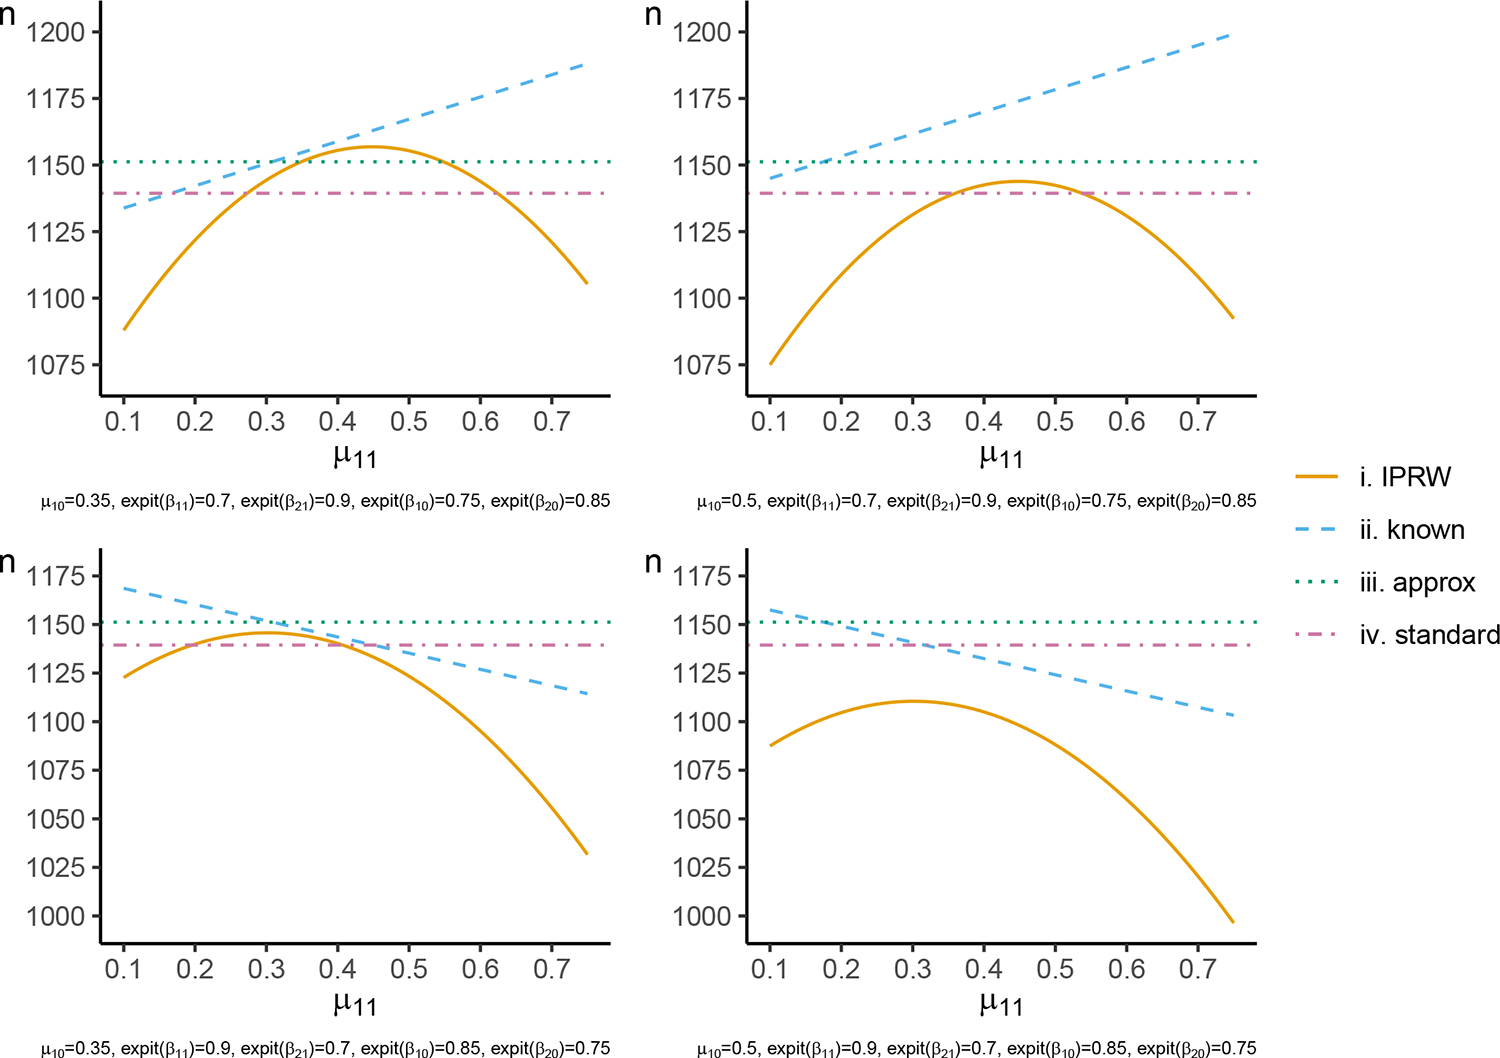
FIGURE 1.

Sample size calculated to detect a risk difference of with 90% power at a two-sided 5% significance level using the , , and formulas. The within-category prevalence of the outcome in the intervention group ( and ) is varied on the x-axis, and within-category prevalence of the outcome in the control group is held fixed at the displayed values of and . The probability of the outcome being observed in each category and intervention group is as displayed for , , and .
