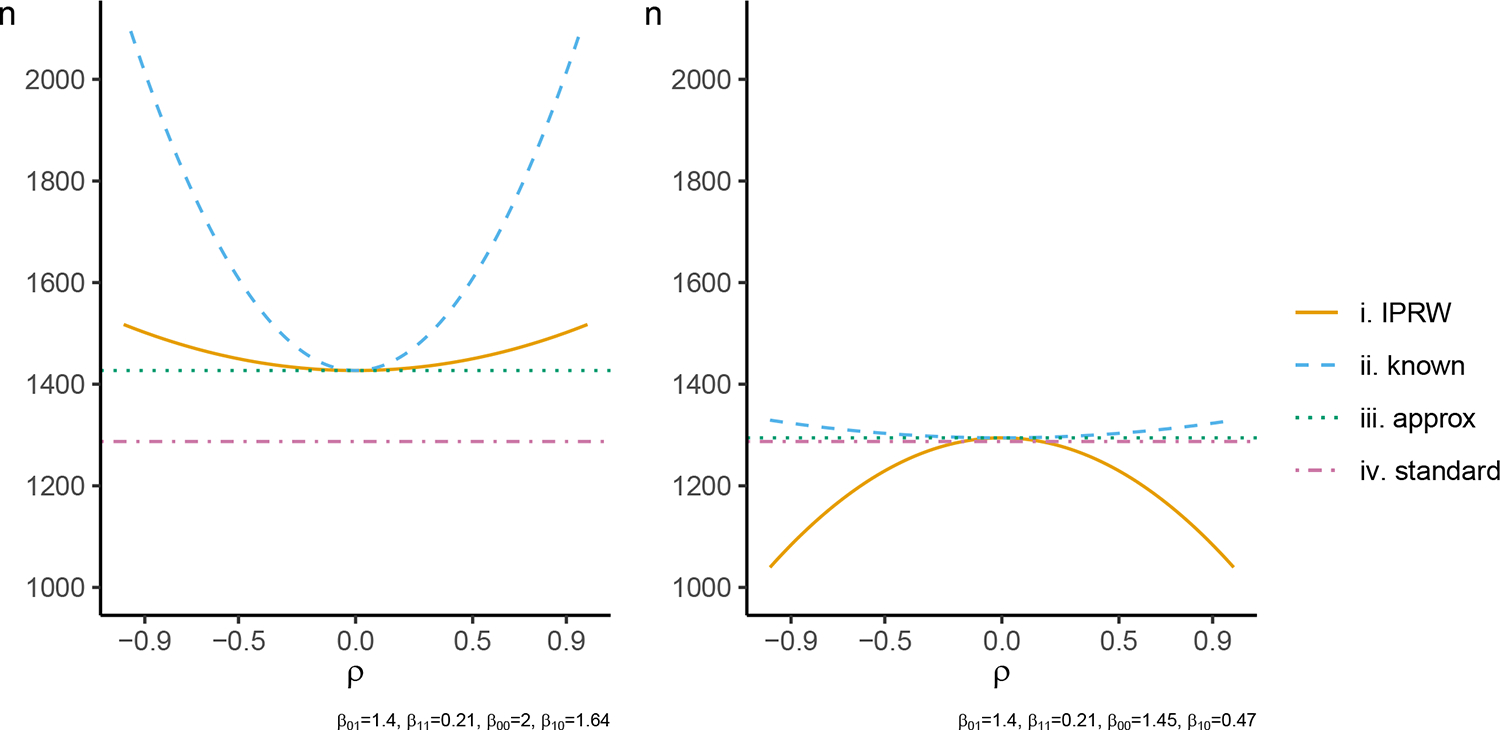
FIGURE 2.

Sample size calculated to detect a mean difference of with 90% power at a two-sided 5% significance level using the , , and formulas. The correlation between the weighting variable and the outcome is varied on the x-axis. The probability of the outcome being observed at each value and intervention group is as displayed for and . is approximated by Gauss-Hermite quadrature with 100 quadrature points.
