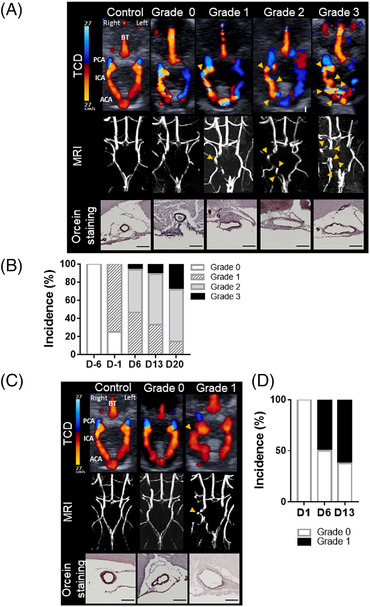
FIGURE 2.

Increased arterial tortuosity detected by TCD imaging and confirmed by MRI uncover intracranial aneurysm formation. Schematic representation of intracranial arteries. Representative TCD and T1‐weighted MRI images of control and grades 0, 1, 2, and 3 mice subjected to the models by Hosaka et al (A) and Nuki et al (C) and the corresponding representative orcein staining of the right ICA (deep purple, elastic lamina; scale bar: 100 μm). Arrowheads indicate abnormal curvatures. Percentage of apparent tortuous arteries, on TCD images, within the circle of Willis during the course of the Hosaka et al model (B) and Nuki et al model (D). ACA indicates anterior cerebral artery; BT, basilar trunk; D, day; ICA, internal carotid artery; MRI, magnetic resonance imaging; PCA, posterior cerebral artery; and TCD, transcranial Doppler.
