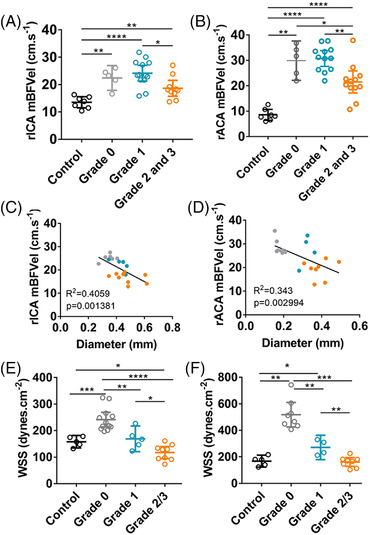
FIGURE 3.

Hemodynamic parameters are altered in highly tortuous intracranial arteries in the Hosaka et al model. A and B, Measurements of the mBFVel in the rICA or rACA by transcranial Doppler of control mice (n=7) and mice subjected to the Hosaka et al model (n=23). C and D, Correlation between the mBFVel and rICA or rACA diameter measured by magnetic resonance imaging (gray, grade 0; blue, grade 1; orange, grades 2/3). E and F, Calculated WSS in the rICA or rACA of control mice and mice subjected to the Hosaka et al model according to their tortuosity grade. Data are represented as mean±95% CI. Kruskal–Wallis test followed by Mann–Whitney test has been used except for (A), where a 1 ANOVA followed by Tukey's posttest was carried out. *P<0.05, **P<0.01, ***P<0.001, and ****P<0.0001. mBFVel indicates mean blood flow velocity; rACA, right anterior cerebral artery; rICA, right internal carotid artery; and WSS, wall shear stress.
