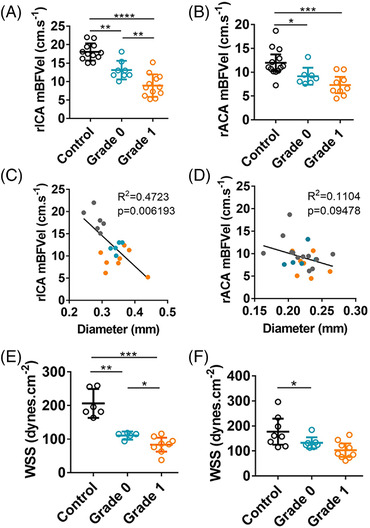
FIGURE 4.

Hemodynamic parameters are altered in tortuous intracranial arteries in the Nuki et al model. A and B, Comparison of the mBFVel, measured by transcranial Doppler, in the rICA or rACA of control mice (n=12) and mice subjected to the Nuki et al model (n= 14) according to their tortuosity grade. C and D, Correlation between mBFVel and rICA or rACA diameter measured by magnetic resonance imaging (gray, control; blue, grade 0; orange, grade 1). E and F, Calculated WSS in the rICA or rACA of control mice and mice subjected to the Nuki et al model according to tortuosity grade. Data are represented as mean±95% CI. Kruskal–Wallis test followed by a Mann–Whitney test has been used. *P<0.05, **P<0.01, ***P<0.001, and ****P<0.0001. mBFVel indicates mean blood flow velocity; rACA, right anterior cerebral artery; rICA, right internal carotid artery; and WSS, wall shear stress.
