
Figure 5.
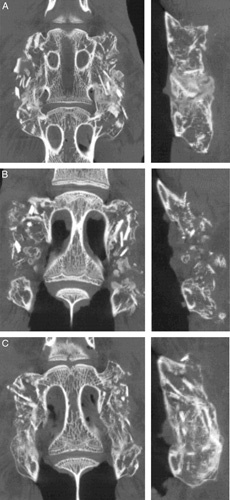
Representative μCTs at 8 weeks in coronal and sagittal planes demonstrating differences in bone formation between anesthesia control (A), dried (B), and hydrated (C) autograft groups. Anesthesia control (A) and hydrated (B) autografts had bilateral fusions bridging the TPs in spines graded as fused. Dried autograft (C) lacked bone bridging between the TPs. μCT indicates microcomputed tomography; TP, transverse process.