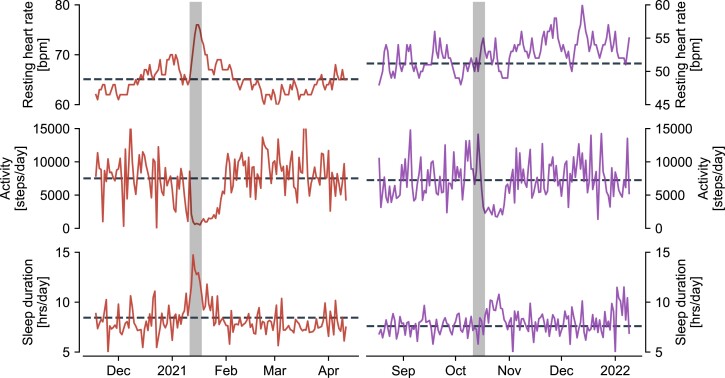
Fig. 1.
Exemplary time series of daily resting heart rate (top), physical activity (middle), and sleep duration (bottom) for a time window of 150 days in two representative individuals who were unvaccinated (left) and vaccinated (right) at the time of taking a PCR test that returned positive (grey shading). Dashed lines denote the user’s baseline, i.e. the average of the 54 days prior to the test. We observe a strong peak in resting heart rate, a drop in physical activity and increased sleep duration for the unvaccinated individual around the time of the test. Similar patterns are observed for the vaccinated individual with respect to physical activity and sleep duration, the latter change being considerably less pronounced. A visible change of resting heart rate is absent for the vaccinated individual around the week of the test.

