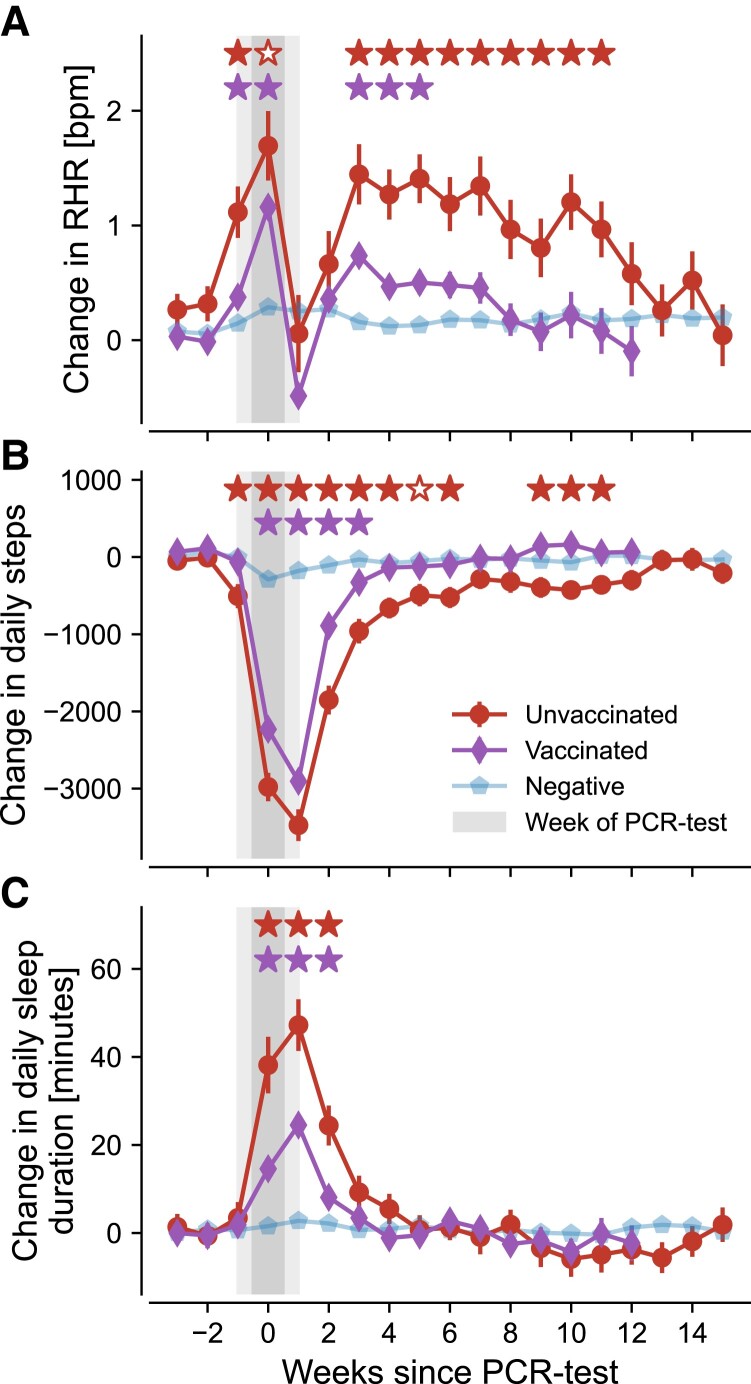
Fig. 2.
Changes in resting heart rate (RHR), activity, and sleep duration in unvaccinated infected (red circles) and vaccinated infected (purple diamonds) as well as negative controls (blue pentagons). Changes are measured relative to the 2 months preceding the test. Errors bars indicate standard error. Filled red stars (upper row of significance indicators in each panel) indicate that average vital changes of unvaccinated individuals were significantly stronger than for both vaccinated and negative individuals. Hollow red stars indicate that average vital changes of unvaccinated participants were only stronger compared to negative individuals but not compared to the vaccinated cohort. Purple stars (lower row of significance indicators in each panel) indicate significant differences between vaccinated and COVID-19 negative individuals. All three assessments use a one-sided Welch t-test with a significance level of . Grey shading indicates the uncertainty in estimating the precise timing of a PCR test, since users only submit this information in terms of the respective calendar week. Results for the vaccinated infected cohort (purple diamonds) are only shown for the first 12 weeks after a positive PCR test due to insufficient data for later time periods. Individuals are considered part of the vaccinated cohort when they received at least two doses of mRNA vaccine.

