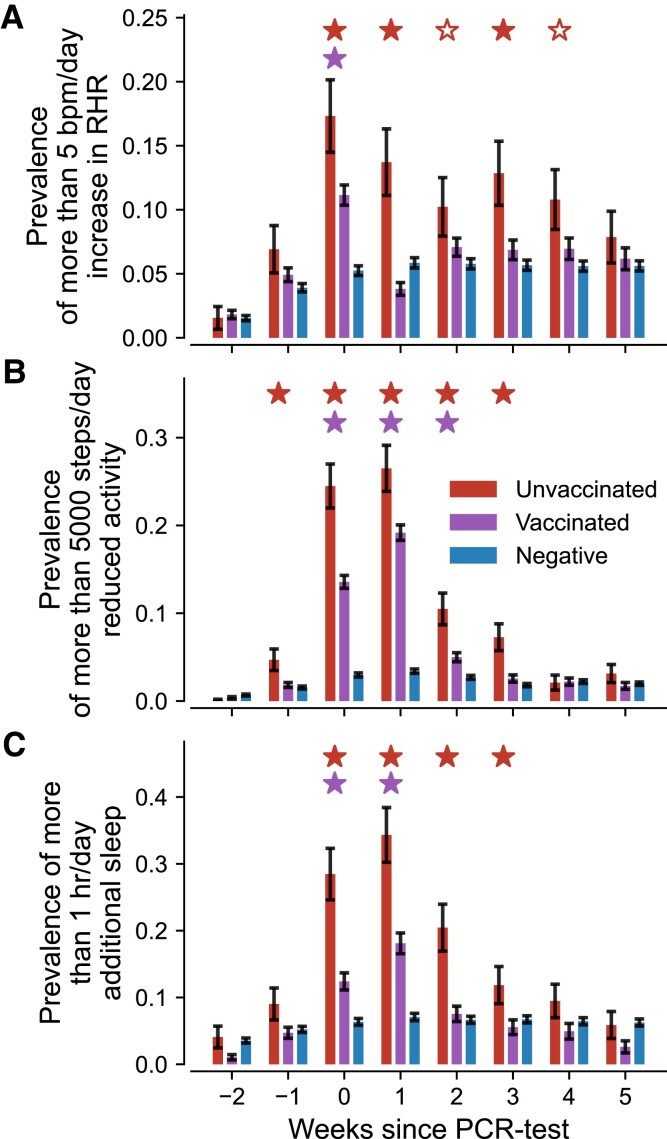
Fig. 4.
Share of individuals in each cohort whose weekly average vital changes exceeded a specified threshold. A) Share of individuals with more than 5 bpm/day RHR increase. B) Share of individuals with an activity reduction of more than 5,000 steps/day. C) Share of individuals with an increased sleep duration of more than 1 h/day. Red (left), purple (center), and blue (right) bars indicate weekly prevalences for the unvaccinated, vaccinated, and COVID-19 negative cohort, respectively. Error bars indicate the standard error of a binomial distribution. Filled red stars (upper row of significance indicators in each panel) indicate periods where the prevalences in unvaccinated individuals were stronger than for both vaccinated and negative individuals. Hollow red stars indicate periods where the prevalences in unvaccinated individuals were only stronger than that of negative individuals but not of the vaccinated cohort. Purple stars (lower row of significance indicators in each panel) indicate significant differences between vaccinated and COVID-19 negative individuals. All three assessments use a one-sided two proportion z-test with a significance level of . Individuals are considered part of the vaccinated cohort when they received at least two doses of mRNA vaccine.

