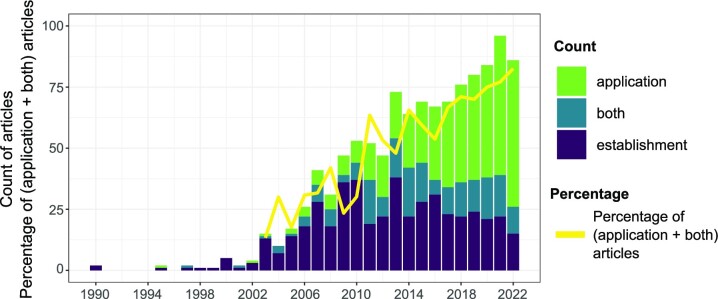
Figure 3.
Number of publications in the broad study design types over the years in the ‘all genetic studies’ pool (narticle = 1122, Fig. 2). The stacked bars show the broad categorization. The yellow line represents the percentage of pooled ‘application’ and ‘both’ categories (i.e. the ‘application studies’, Fig. 2) in the ‘all genetic studies’ pool.

