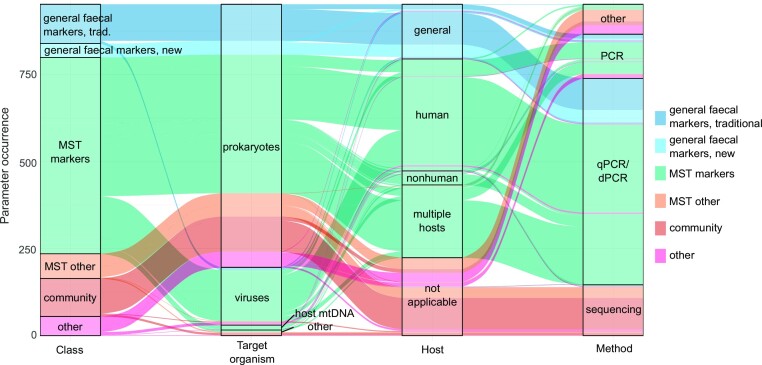
Figure 6.
Alluvial plot showing the occurrence of genetic parameter types in the ‘application studies’ pool (narticle = 649). Each item, i.e. each line corresponds to one parameter measured in one study, so one ‘class’—‘target organism’—‘host’—‘method’ assignment. The thickness of the stratum (ribbon) corresponds to the number of studies that measured that particular class–organism–host–method combination. However, since a study might have measured several genetic parameters, the y-axis does not correspond to the number of articles in the ‘application studies’ pool.

