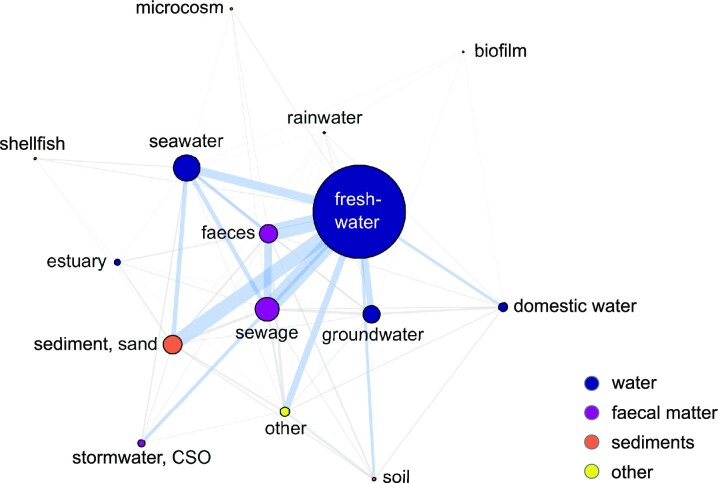
Figure 7.
Network analysis of the ‘sample type’ assignment occurrence in the ‘application studies’ pool (narticle = 649). The node size is proportional to the number of articles, the line thickness reflects the number of articles for a respective combination. Blue lines mark more than 10 co-occurrences while grey lines show less than 10 co-occurrences. CSO denotes combined sewer overflow.

