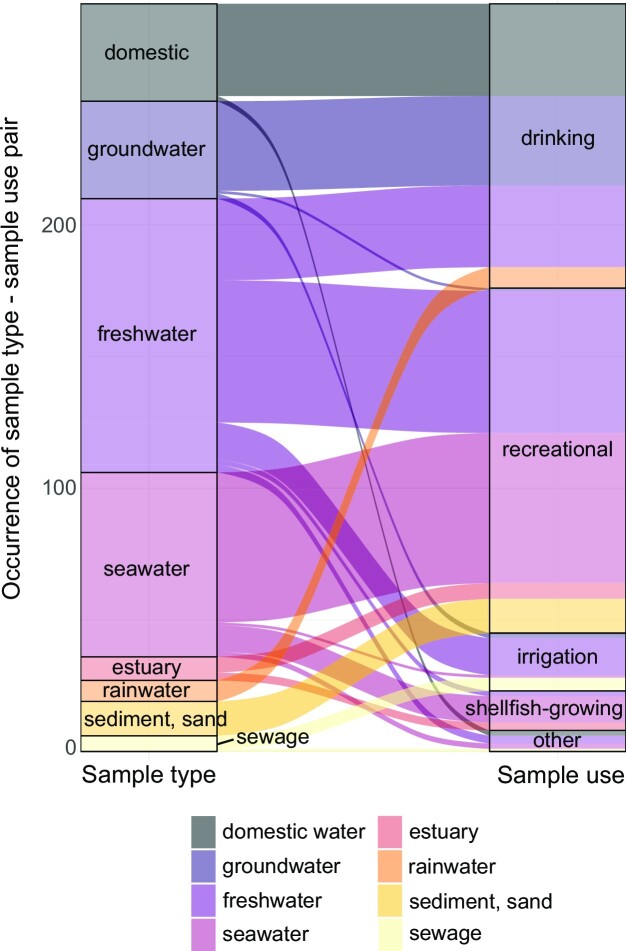
Figure 8.
Alluvial plot showing the ‘sample type’—‘sample use’ combinations in the subpopulation of ‘application studies’ that reported this information (narticle = 254 articles). Since a study might have analysed several ‘sample types’, or indicated several ‘water uses’, the y-axis does not correspond to the total number of articles.

