. 2023 Jul 25;12:e83884. doi: 10.7554/eLife.83884

Figure 2. Supplementation of lysate does not restore the UPRER suppressed by let-767 RNAi.

(A) Fluorescent micrographs of transgenic animals expressing hsp-4p::GFP grown on Empty Vector (EV) or let-767 RNAi combined in a 1:1 ratio with either EV or sec-11 RNAi supplemented with vehicle or N2 lysate to assay effects on UPRER induction. (B) Quantification of (A) normalized to size using a BioSorter. Lines represent mean and standard deviation. n=189. Mann-Whitney test p-value ****<0.0001. Representative data shown is one of three biological replicates. (C) Representative fluorescent micrograph projections of day 1 adult transgenic animal expressing LD-localized dhs-3::GFP, grown on EV or let-767 RNAi with or without N2 lysate supplementation to assay LD quality. Yellow arrowheads point to example lipid droplets. Scale bar, 5 μm. (D) Representative fluorescent micrograph projections of day 1 adult transgenic animal expressing ER lumen-localized mRuby::HDEL, grown on EV or let-767 RNAi with or without N2 lysate supplementation to assay ER quality. Orange arrowheads point to wide ER structures. Scale bar, 5 μm. Images for organelle markers individually contrasted for clarity.

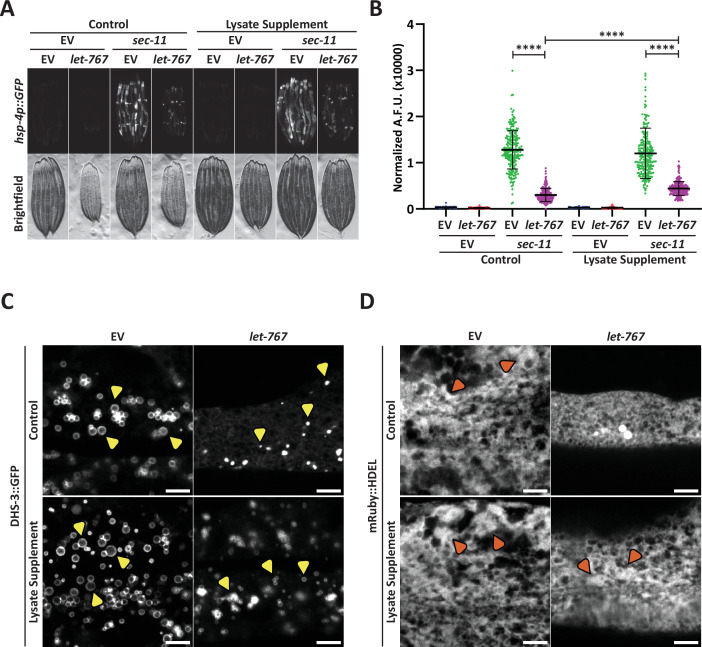
Figure 2.

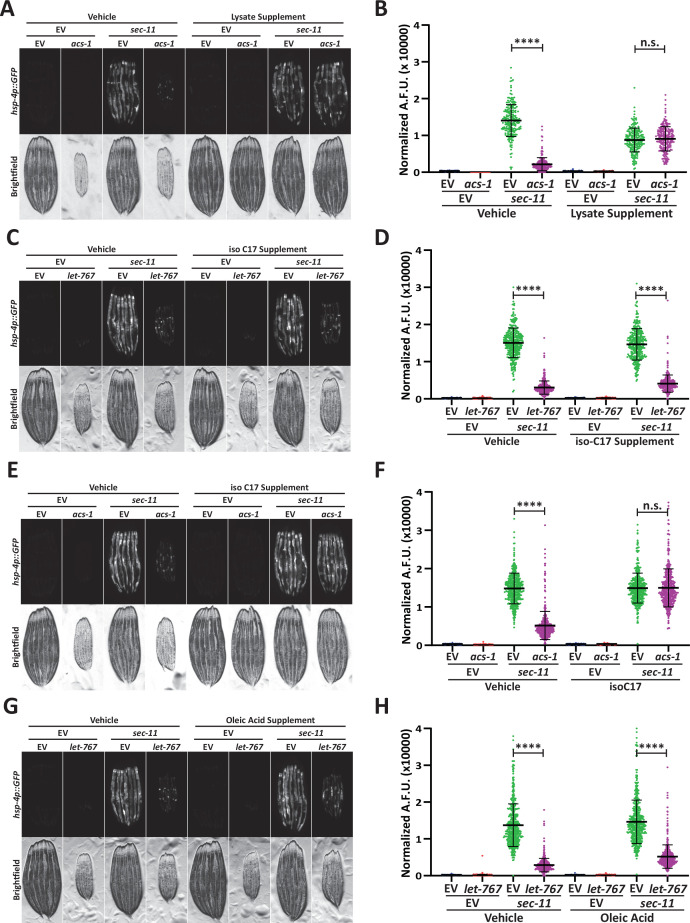
Figure 2—figure supplement 1. Supplementation of mmBCFA or oleic acid does not restore the UPRER suppressed by let-RNAi.

Figure 2—figure supplement 1.

(A) Fluorescent micrographs of transgenic animals expressing hsp-4p::GFP grown on EV or acs-1 RNAi combined in a 1:1 ratio with either EV or sec-11 RNAi supplemented with vehicle or N2 lysate to assay supplementation efficacy. (B) Quantification of (A) normalized to size using a Biosorter. Lines represent mean and standard deviation. n=211. Mann-Whitney test p-value ****<0.0001. n.s.=non-significant. Representative data shown is one of three biological replicates. (C) Fluorescent micrographs of day 1 adult transgenic animals expressing hsp-4p::GFP grown on Empty Vector (EV) or let-767 RNAi combined in a 1:1 ratio with either EV or sec-11 RNAi grown with vehicle or 0.5 mM isoC17 to assay effects on UPRER induction. (D) Quantification of (C) normalized to size using a BioSorter. Lines represent mean and standard deviation. n=338. Mann-Whitney test p-value ****<0.0001. Representative data shown is one of three biological replicates. (E) Fluorescent micrographs of day 1 adult transgenic animals expressing hsp-4p::GFP grown on EV or acs-1 RNAi combined in a 1:1 ratio with either EV or sec-11 RNAi grown with vehicle or 0.5 mM isoC17 to assay effects on UPRER induction. (F) Quantifation of (E) normalized to size using a BioSorter. Lines represent mean and standard deviation. n=428. Mann-Whitney test p-value ****<0.0001, n.s.=non-significant. Representative data shown is one of three biological replicates. (G) Fluorescent micrographs of day 1 adult transgenic animals expressing hsp-4p::GFP grown on EV or let-767 RNAi combined in a 1:1 ratio with either EV or sec-11 RNAi grown with vehicle or 1 mM oleic acid to assay effects on the UPRER induction. (H) Quantification of (G) normalized to size using a BioSorter. Lines represent mean and standard deviation. n=461. Mann-Whitney test p-value ****<0.0001. Representative data shown is one of three biological replicates.