. 2023 Jul 11;12:e84969. doi: 10.7554/eLife.84969

Figure 2. Chromatin accessibility dynamics during anterior-posterior (AP) patterning of the early Tribolium embryo.

(A) Embryos 23–26 hr after egg lay (AEL) (IT23) or 26–29 hr AEL (IT26) were dissected and cut into anterior (a), middle (m), and posterior (p) part. Up: nGFP embryo in the eggshell. Below: dissected and cut nGFP embryo. (A’) A schematic version of (A). (A’’) Representative Tribolium embryo at 23–26 hr AEL (IT23) or 26–29 hr AEL (IT26) in situ stained to visualize the expression of the gap gene hunchback (hb) (green; Hoechst in gray). (B) Principal component analysis (PCA) on the accessibility scores of the most highly accessible and variable sites in the dataset. Only the first two principal components (PC) of the data are represented. The first PC explains 45.3% of the variance in the data, and the second PC, 18.0%. (C, D) Boxplots showing the scores of PC1 and PC2 by space (C) and time (D). The thick line indicates the median (2nd quartile), while the box represents the interquartile range (IQR, 1st to 3rd quartiles). Outliers are shown as dots. (E) Genomic annotation of different classes of chromatin accessible sites: all (consensus) sites, constitutive sites (i.e. consensus sites that are not differentially accessible), all differentially accessible sites, and most specifically accessible sites (i.e. sites differentially accessible in four or more comparisons). (F) K-means clustering of accessibility scores for differentially accessible sites. Accessibility scores have been z-score scaled for each site.

Figure 2.

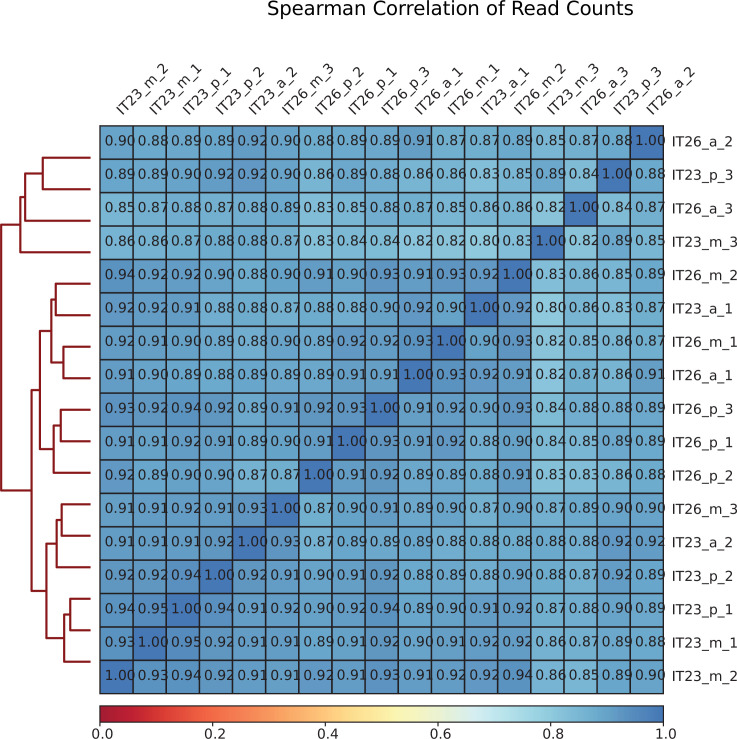
Figure 2—figure supplement 1. Correlation between Assay for Transposase-Accessible Chromatin with high-throughput sequencing (ATAC-seq) sequencing libraries.

Figure 2—figure supplement 1.

Mapped sequencing reads of each biological replicate were used to calculate the correlation between pairs of replicates. The values represent the Pearson correlation coefficients between pairs of sequencing libraries.
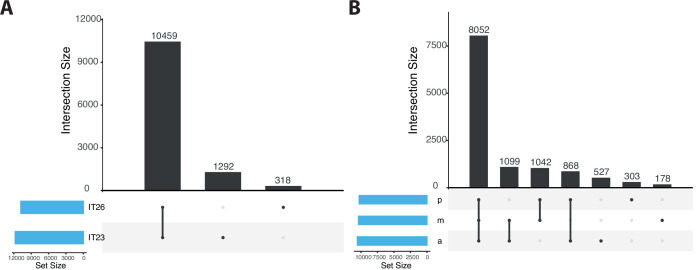
Figure 2—figure supplement 2. Upset plot comparing the number of sites identified in samples corresponding to IT23 and IT26 as well as along the anterior-posterior (AP) axis.

Figure 2—figure supplement 2.

(A) Plot corresponding to IT23 and IT26. (B) Plot corresponding to samples along the AP axis (a, m, and p). The number of sites in each of the sets considered is represented by the width of the bars in the bar chart at the bottom left. Each bar in the bar chart at the top represents the number of sites in an intersection. The intersection is indicated by filled circles below each bar. Note that the intersection sets are disjoint.
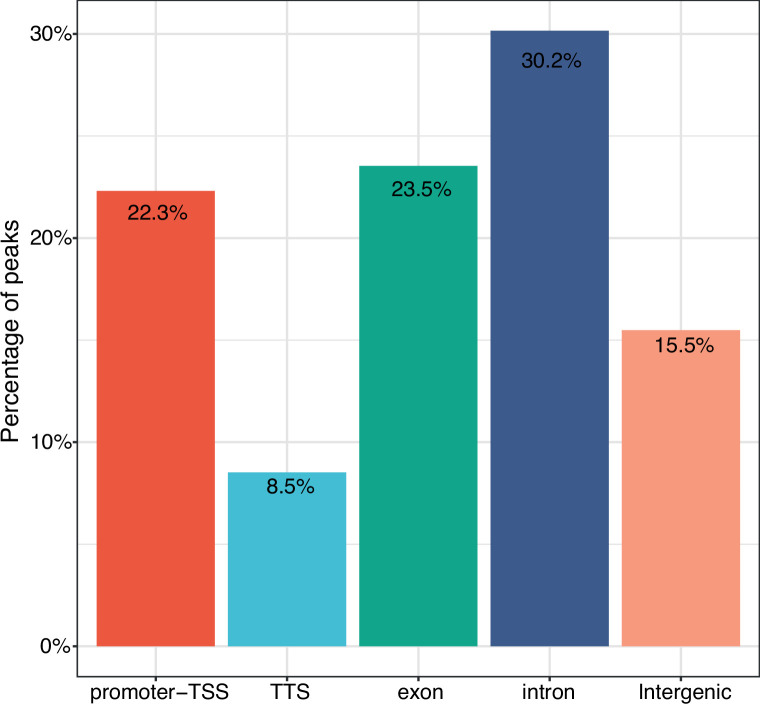
Figure 2—figure supplement 3. Annotation of consensus sites.

Figure 2—figure supplement 3.

A total of 12,069 consensus sites were analyzed. Consensus sites overlap with promoter-TSS (22.3%), TSS (8.5%), exons (23.5%), introns (30.2%), and intergenic regions (15.5%), respectively. TSS: Transcription Start Site.
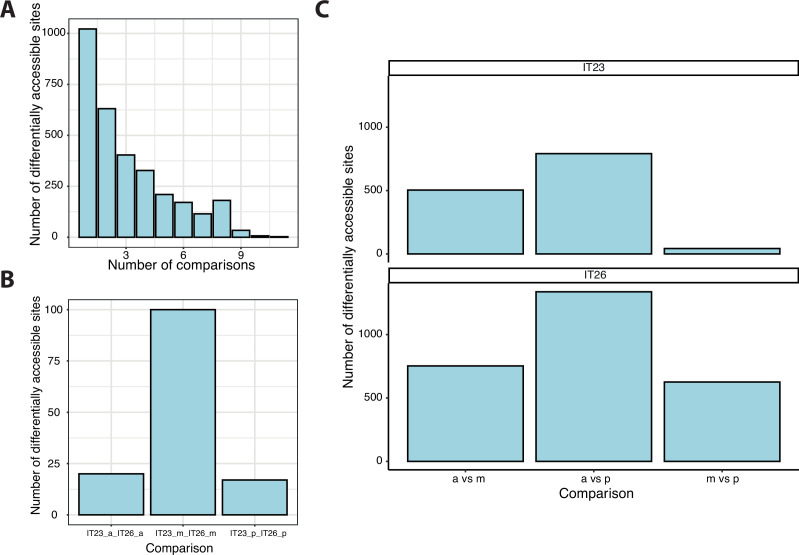
Figure 2—figure supplement 4. Analysis of differentially accessible sites.

Figure 2—figure supplement 4.

(A) The accessibility of sites was compared between three different parts of the germband (anterior, middle, and posterior) at two-time points (IT23 and IT26). All possible 15 comparisons were considered. A total of 3106 sites were differential accessible. (B) For the same part of the embryo, 132 sites were differentially accessible between two-time points. (C) A total of 2109 sites were differentially accessible between two different parts of the germband at a given time point.