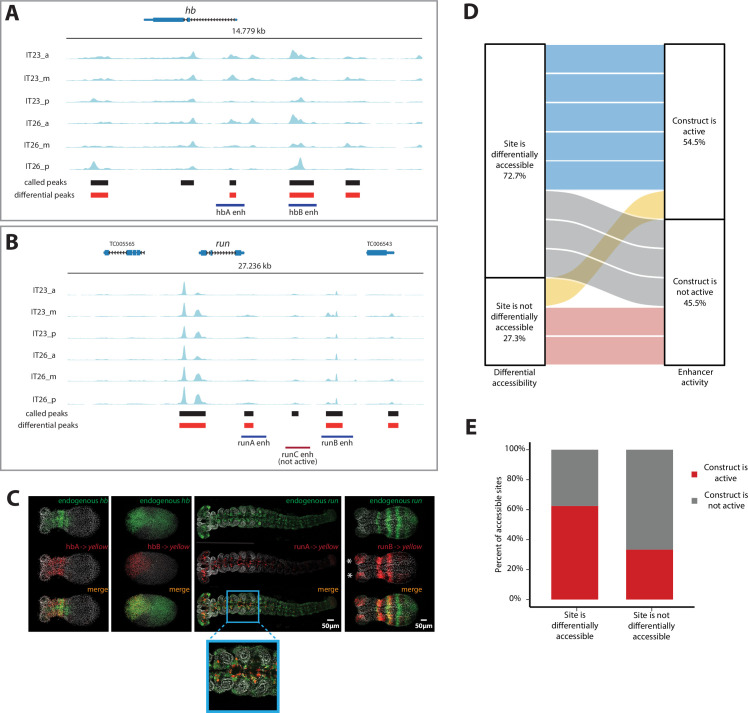
Figure 4. Correlation of enhancer activity with differential accessibility.
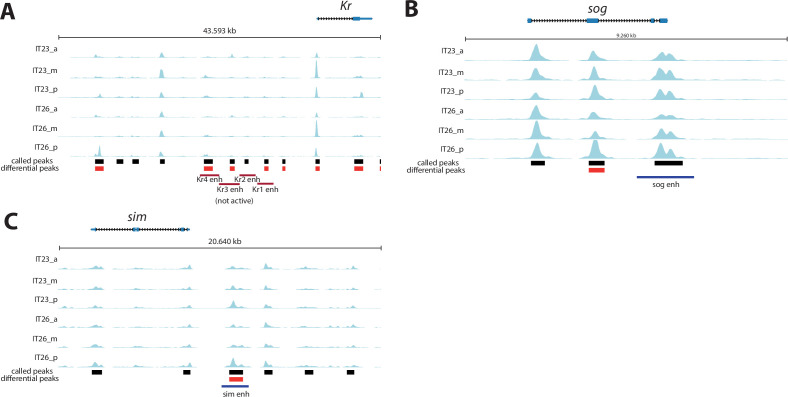
(A, B) The Assay for Transposase-Accessible Chromatin (ATAC) profiles (two-time points (IT23, IT26) with three embryo regions (a, m, p) per time point) for hunchback (hb) (A) and run (B). Tested enhancer regions at these loci are shown as boxes underneath the ATAC profiles. Differential accessible sites match well with active enhancer regions (purple boxes; red box: not active enhancer construct). ATAC tracks were created with pyGenomeTracks. (C) Enhancer reporter constructs for active enhancer regions are shown in (A) and (B), in which mRNA transcripts were visualized using in situ hybridization chain reaction (HCR) staining (endogenous gene expression: green, reporter gene expression: red, merge: yellow). Nuclear staining (Hoechst) is in gray. hbA drives reporter gene expression in a stripe (embryo in germband stage shown). hbB drives reporter gene expression in the serosa (embryo in blastoderm stage shown). runA drives reporter gene expression in a subset of the endogenous run CNS expression (embryo in late germband stage shown). runB drives reporter gene expression in stripes outside of the most posterior part of the embryo (embryo in germband stage shown). Posterior to the right. (D) The correlation between differential accessibility and construct activity was determined. Eleven enhancer constructs were analyzed: 54.5% of constructs (six constructs) were active and 45.5% of constructs were not active (five constructs). Five out of six active constructs are associated with sites that are differentially accessible, while one active construct overlaps with a site that is not differentially accessible. Two out of five not active constructs match sites that are not differentially accessible, while the remaining three not active constructs are associated with sites that are differentially accessible (see Figure 4—figure supplement 1 for details). (E) Enhancer prediction efficiency of our enhancer prediction method based on differential peak analysis. Same enhancer constructs were analyzed as in (D). About 60% of analyzed differential peaks were associated with active enhancer construct regions whereas in about 40% of analyzed cases, differential peaks could be found at not active enhancer construct regions. In contrast, about 70% of analyzed non-differential peaks were associated with not active enhancer construct regions. About 30% of analyzed non-differential peaks are associated with active enhancer construct regions.


