. 2023 Jul 11;12:e84969. doi: 10.7554/eLife.84969

Figure 5. Simulation of the Enhancer Switching model with different static enhancer strengths.

Shown are simulation outputs of the Enhancer Switching model for a reporter gene driven by dynamic (yellow) or static (black) enhancers, as well as an endogenous gene driven by both dynamic and static enhancers (green). Two versions of the model were simulated and contrasted: with strong (A) vs weak (B) static enhancer activity. (A) Model simulation with strong static enhancer activity. Each wave of the endogenous gene expression follows first the dynamics of the dynamic enhancer and switches along space (in the tapering direction of the speed regulator, shown in gray) and time to the dynamics of the static enhancer to form a stable expression domain. (B) Model simulation with a weaker static enhancer: dynamic enhancer activity resembles endogenous gene expression pattern. Left panels: spatial plots across time. Right panels: Kymographs.

Figure 5.

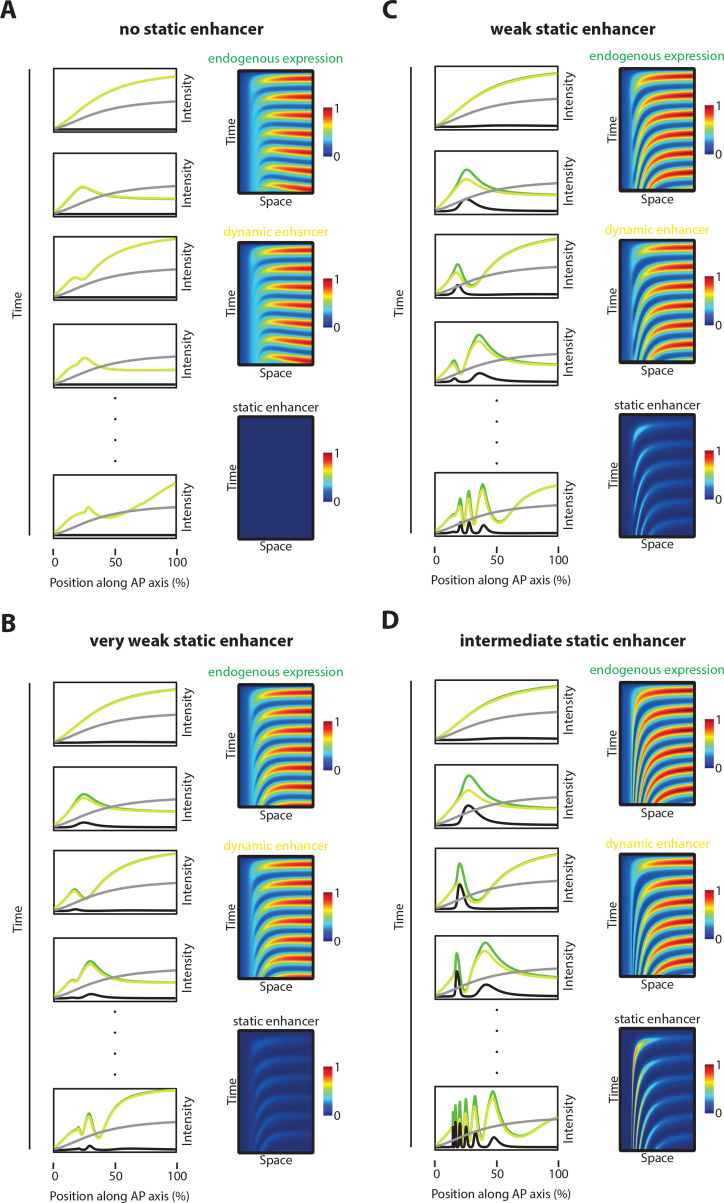
Figure 5—figure supplement 1. Simulations with different static enhancer strengths.

Figure 5—figure supplement 1.

Computational simulation of reporter gene expression driven by dynamic (yellow) or static enhancer (black), respectively as well as endogenous gene expression (green) driven by both, dynamic and static enhancer. Analyzed was the spatiotemporal pattern of gene expression. (A) No static enhancer: dynamic enhancer strength d=3, static enhancer strength c=0 (same as in Figure 7B, deleted static enhancer). Each wave of the endogenous gene expression follows the dynamics of the dynamic enhancer. Due to the lack of static enhancer activity, endogenous gene expression waves fail to stabilize as stable expression domains. (B) Very weak static enhancer: d=3, c=0.5. Each wave of the endogenous gene expression follows the dynamics of the dynamic enhancer. Due to very weaker static enhancer activity, dynamic enhancer activity resembles the whole gene expression pattern (compare to Figure 5B). Endogenous gene expression waves are impaired in forming stable expression domains. (C) Weak static enhancer: d=3; c=1. Dynamics of the endogenous gene expression are mainly governed by dynamic enhancer activity. Weak static enhancer activity stabilizes endogenous gene expression waves as stable expression domains. (D) Intermediate strong static enhancer: d=3, c=1.5. Each wave of the endogenous gene expression follows first the dynamics of the dynamic enhancer and switches along space to the dynamics of the intermediate strong static enhancer to form a stable expression domain. Left panel: Intensity plots. The speed regulator is shown in gray. Right panel: Kymographs.