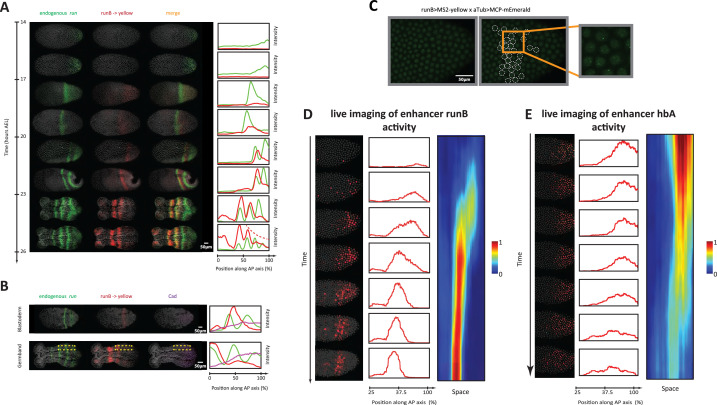
Figure 6. Analysis of enhancer activity dynamics using the MS2-MCP live imaging system.
(A) Shown are spatiotemporal dynamics of endogenous run (green) and the reporter gene yellow (red) expression in runB->yellow embryos. Left panel: Time-staged embryos from 14 to 26 hr after egg lay (AEL) at 24 °C, in which mRNA transcripts (run: green, yellow: red) were visualized using in situ hybridization chain reaction (HCR) staining. Nuclear staining (Hoechst) is in gray. Right panel: Intensity distribution plots along the AP axis. Both run and runB->yellow are expressed in waves that propagate from posterior to anterior. runB->yellow expression wave, however, starts weak posteriorly and progressively increases in strength as it propagates towards the anterior, until it eventually overlaps with the stabilized run stripes anteriorly. (B) Left panel: in situ HCR staining for endogenous run (green) and reporter gene yellow expression (red) combined with antibody staining for Cad proteins (purple) in a runB->yellow blastoderm embryo (upper row) and a runB->yellow germband embryos (lower row). Nuclear staining (Hoechst) is in gray. Right panel: Intensity distribution plots along the AP axis for yellow expression in a whole Tribolium blastoderm (upper panel), and within the region indicated in dashed yellow in a Tribolium germband. Cad forms a posterior-to-anterior gradient in both balstoderm and germband embryos. runB activity increases progressively as Cad concentration drops towards anterior. (C) Live imaging snapshot of a runB >MS2-yellow; aTub >MCP-mEmerlad Tribolium embryo. Diffuse mEmerald signal is observed in nuclei. mEmerald fluorescence is enriched at transcription sites (bright puncta: MS2-MCP signal). Left panel: original snap shot; Middle: nuclei that exhibit MS2-MCP signal are outlined in white circles; Right: A close-up to nuclei with MS2-MCP signal. (D, E) Tracking estimated mRNA activity driven by runB (D) and hbA (E). Left panels (in both (D) and (E)): Snapshots across time from live embryo movies in which nuclei (shown in gray) are tracked and MS2 signals are averaged over time (using a moving average filter with a length of 10 movie frames) to estimate mRNA activity (shown in red). Middle panel: Intensity distribution plots along space for representative images in left panel. Right panel: A kymograph showing estimated mRNA activities of enhancer reporters across space and time. In all embryos shown: posterior to the right.


