. 2023 Jul 25;12:e83659. doi: 10.7554/eLife.83659

Figure 1. Schematic of experimental design and theoretical models.

The study examined the formation dynamics of immunological synapses (IS) elicited by a bispecific T cell engager (BiTE). (a) The abundance and dynamics of IS formation were quantified by imaging flow cytometry under various experimental conditions. (b) Three mechanistic agent-based models were developed for the comprehensive characterization of cell-cell engagement and tumor-killing effects on different spatiotemporal scales. 3-D, three-dimensional; 2-D, two-dimensional.

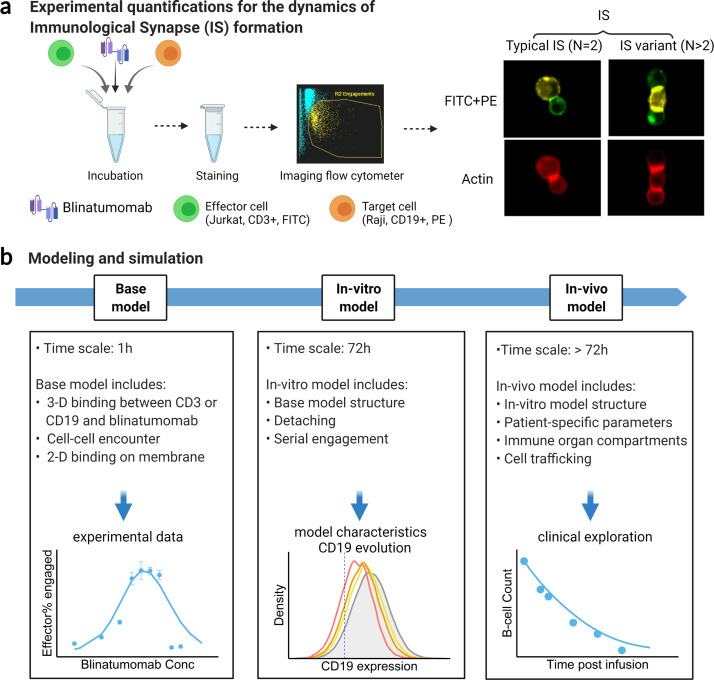
Figure 1.

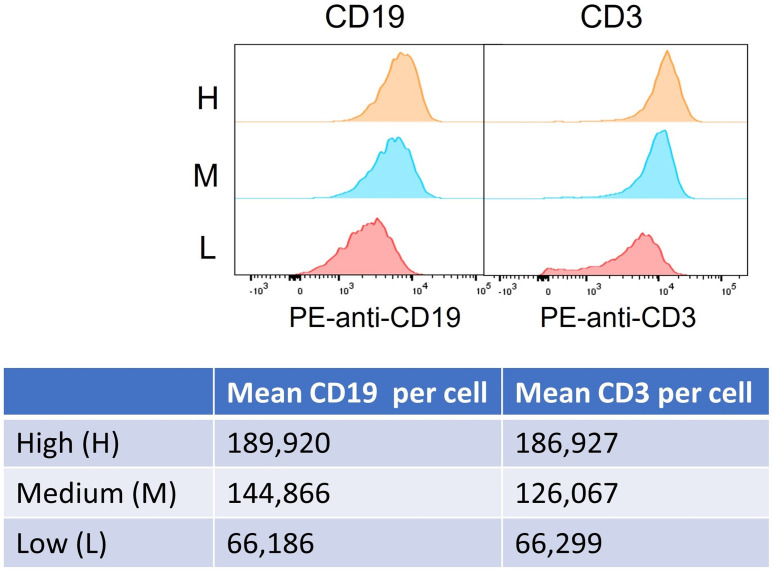
Figure 1—figure supplement 1. Histogram and quantification of high (H), medium (M), and low (L) antigen expression (CD19 and CD3) in cell subpopulations.

Figure 1—figure supplement 1.

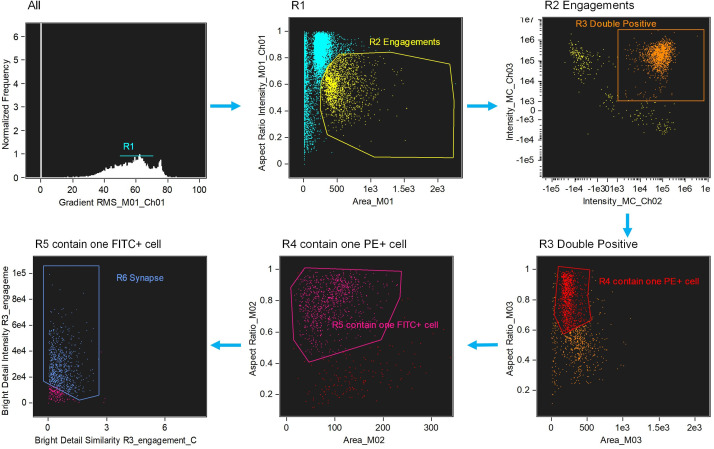
Figure 1—figure supplement 2. Image-based algorithms and gating strategy to identify typical immunological synapse (IS).

Figure 1—figure supplement 2.

Step 1, gate cells in best focus (R1). Step 2, gate conjugates (R2). Single cells (intermediate area value and high aspect ratio) are excluded. Step 3, gate CD3 and CD19 double positive (R3, FITC+PE+). Step 4, gate conjugates with only one target cell (R4). Step 5, gate conjugates with only one effector cell (R5). This subpopulation consists of doublets with only one effector and one target cell. Step 6, gate immunological synapse (R6). 'Valley’ mask is employed to quantify actin intensity in the region of contact (Bright detail intensity). Co-localization wizard is used to measuring overlap (Bright detail similarity). For technical details, please see the user’s manual of IDEAS.