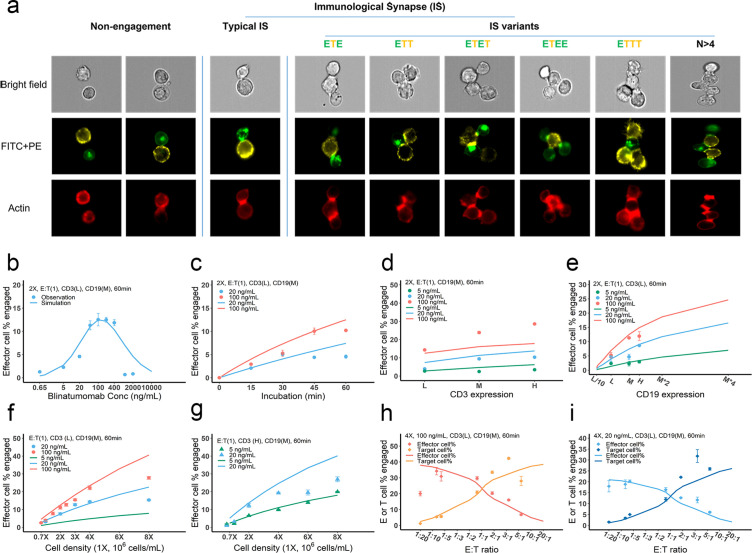
Figure 3. Dynamics of immunological synapse (IS) formation induced by bispecific T cell engager (BiTE) under different conditions.
(a) Representative image of non-engagement (futile encounter), typical IS, and other IS variants. Green (FITC), effector cells (E); Yellow (PE), target cells (T). (b–i), The effects of drug concentration (b), incubation duration (c), antigen density (d, e), cell density (f, g), and E:T ratio (h, i) on IS formation. The base model was applied to simulate IS formation under different conditions. Observations are dots (with SE) and model simulations are solid curves. 2 X, 2 × 10⁶ total cells/mL; E:T(1), E:T ratio = 1; CD3(L), CD3 expression (Low); CD3(H), CD3 expression (High); CD19(M), CD19 expression (medium); 5, 20, 100 ng/mL, blinatumomab concentration; 60 min, incubation duration. All samples were biologically triplicates.


