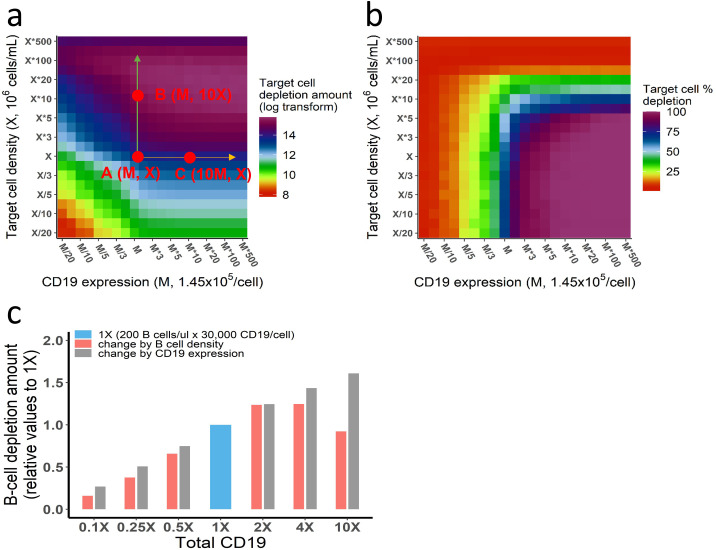
(a–b) Different effects of target cell density and CD19 expression on target cell depletion amount (a) and fraction (b). The in vitro model was used in the simulation. Initial setup: CD3(L), effector cell (1 X), target cell (X/20 to 500 X), CD19 expression (M/20 to 500 M), 0.65 ng/mL, 72 h. Total CD19 in the system was jointly influenced by CD19 expression per target cell and target cell density. CD19 expression influenced cell lysis to a similar extent as target cell density when both factors were low (e.g. CD19 expression <M, target cell density <X in (a)). However, further increase of CD19 expression on cell membrane did not further improve cell lysis (e.g. from point A to point C), indicating maximum ternary complexes at each interface have been reached. In contrast, the increase of target cell density continuously promotes cell lysis, e.g., from point A to B, due to enhanced probability of cell-cell encounter. When the target cell density reaches extremely high (>50 X), cell lysis started to decrease, resulting from fewer cell-cell adhesion events due to insufficient bispecific T cell engager (BiTE) concentration. As shown, although total CD19 in the system at point B and C are identical (10 × M × X), different cell lysis level is yielded, supporting different effects of CD19 on cellular and molecular processes. (c) Effects of B cell density and CD19 expression on B cell depletion in vivo. In each group, the change of total CD19 density from the reference (1 X, 200 B cells/μL × 30,000 CD19/cell) was achieved through changing B cell density (red bar) or CD19 expression (gray bar). Their effects on B cell depletion amount were simulated by the in vivo model. Initial setup for reference (1 X): T cell (200 /μL), B cell (200 /μL), CD3 (50, 000 /cell), CD19 (30, 000 /cell), 0.73 ng/mL, 72 h. Different effects of CD19 on cellular and molecular processes have been confirmed by the in vivo model. Similarly, the increase of CD19 expression within low-level range (3 × 10³–3 × 10⁵ CD19/cell from 0.1X to 10X) constantly improved cell depletion, as ternary complexes formation at each interface increased with CD19 expression. By contrast, a bidirectional effect was shown by increasing B cell density, owing to enhanced probability of cell-cell encounter at the population level and then insufficient BiTE concentration. Herein, B cell density at 10 X (2000 /μL) in the blood indicates extremely high organ B cell density in the model, e.g., spleen (~9 × 10⁸ /mL) and lymph nodes (~3 × 10⁸ /mL).


