. 2023 Jul 25;12:e83659. doi: 10.7554/eLife.83659

Figure 6. The in vivo model predicted clinical pharmacodynamics and tumor evolution across anatomical sites.

(a) Scheme of organ compartment and cell trafficking. Remainder, all the rest of the non-lymphoid organs; kB cell, the turnover rate of B cell; ktraff, in and ktraff out, B cell trafficking rate. For parameters and trial information, see Materials and methods, and Supplementary file 1b and c; (b–e) Observed and simulated patient B cell profiles in blood; (f) Simulated CD19 evolution in non-responder patients of trial MT103-211; (g) Simulated cell lysis potency for each organ in trial MT103-104; (h) Simulated baseline (day 0), and post-treatment (day 7 and 14) B cell organ distribution in patients with OS >30 months of trial MT103-206. Bar plot, simulated baseline and post-treatment tumor burden; (i–l) Sensitivity analyses for the impact of drug concentration (i), T cell density (j), B cell density (k), and CD19 expression (l) on B cell depletion. T cell density change is allowed in the simulations (b–e), details see Supplementary file 1b. BM, bone marrow; LN, lymph nodes; OS, overall survival; Rmd, remainder.

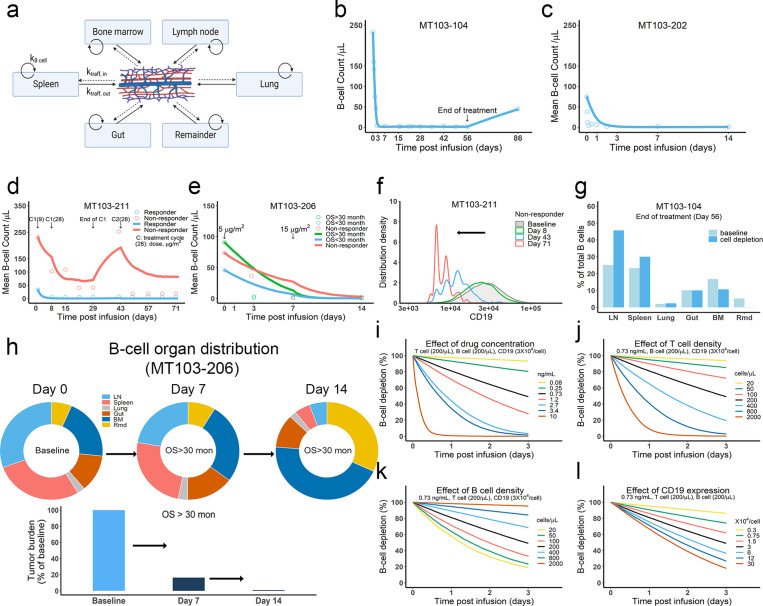
Figure 6.

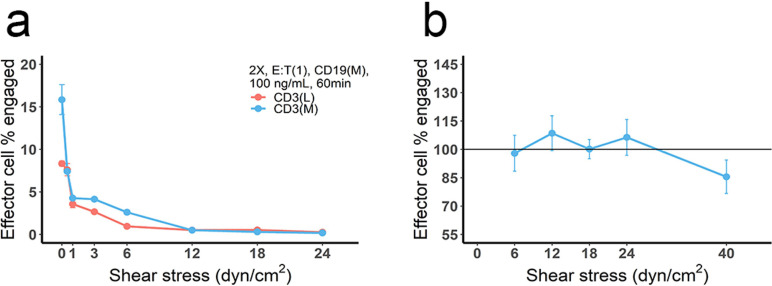
Figure 6—figure supplement 1. The effect of blood flow on the production and stability of immunological synapses (IS).

Figure 6—figure supplement 1.

(a) Cell co-culture was conducted at different flow velocities, producing different shear stresses to mimic the effect of blood flow. Initial setup: 2 X, 2 × 10⁶ total cells/mL; E:T(1), E:T ratio = 1; CD3(L), CD3 expression (Low); CD3(M), CD3 expression (medium); CD19(M), CD19 expression (medium); 100 ng/mL, blinatumomab concentration; 60 min, incubation duration. (b) Cell incubation was conducted at static condition (initial setup: 2 X, E:T(1), CD19(M), CD3(L), 100 ng/mL, 60 min, shear stress = 0) and followed by adding different shear stresses (5 min) to test the stability of pre-existing IS. The reference line (100%) indicated the frequency of the effector cells engaged at static condition.
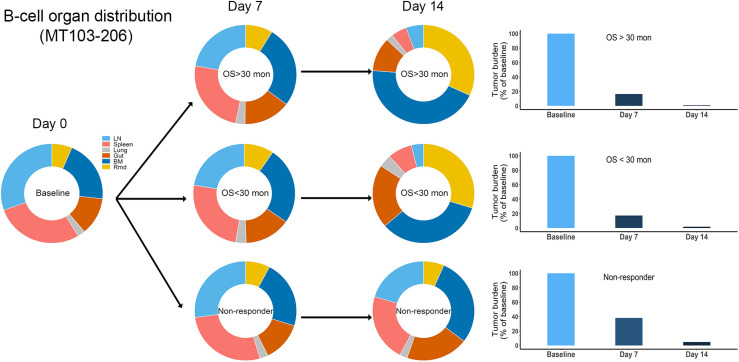
Figure 6—figure supplement 2. Simulated baseline (day 0), and post-treatment (day 7 and 14) B cell organ distribution in patients of trial MT103-206.

Figure 6—figure supplement 2.

The in vivo model was applied to perform the simulations. Bar plot showed the simulated tumor burden at baseline and post-treatment. BM, bone marrow; LN, lymph nodes; OS, overall survival; Rmd, remainder, all the rest of the non-lymphoid organs.