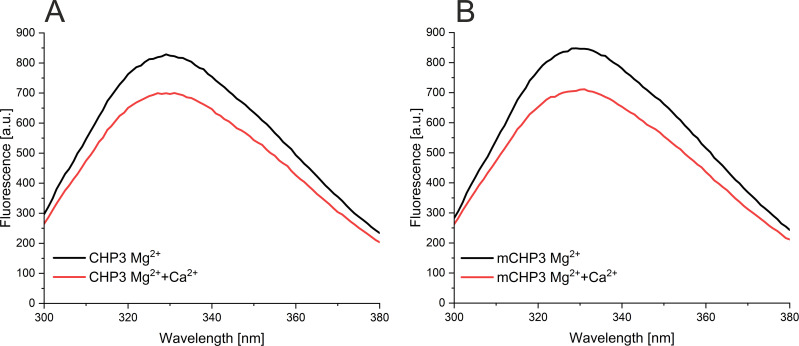
Figure 2. Ca2+-induced conformational changes in CHP3 and mCHP3.
(A) Kinetic fluorescence probe hydrophobicity (FPH) assay. Fluorescence of dye bound at hydrophobic protein surfaces was monitored at λem = 585 nm (excitation λex = 470 nm) and at 22°C. Protein (1.5 µM) was prepared in the Mg2+-bound state (2 mM MgCl2, 1 mM EGTA). CaCl2, EDTA, and EGTA were sequentially added as indicated. First, 2 mM CaCl2 was added and then chelated with addition of 3 mM EGTA. Next, 3 mM EDTA was added to remove both divalent ions (CHP3 in apo-state) followed by another addition of 4 mM CaCl2. (B) Intrinsic tryptophan fluorescence was monitored at λem = 330 nm (excitation λex = 280 nm) at 22°C. Protein (2.5 μM) in the Mg2+-bound state was used and the additions were performed as described above for the FPH assay. (C) AlphaFold2.0 model (Varadi et al., 2022) of CHP3 in surface presentation, with surface coloured for hydrophobicity (Eisenberg et al., 1984). The model most likely resembles the open or target-bound conformation. The single tryptophan residue highlighted in green (Trp191) is located in the hydrophobic target-binding pocket. EC50 values for binding of Ca2+ to CHP3 (D) and mCHP3 (E) determined with FPH assay. Fluorescence of samples with CHP3 or mCHP3 at different Ca2+ concentrations was measured at 590 nm in the presence of 2 mM MgCl2. Three biological replicates (shown in different colours) with three to four technical replicates each for CHP3 and mCHP3 were measured. The data were fitted with Hill equation using global non-linear regression. (F) 95% confidence intervals (Δχ2 of 3.84) of EC50 values for binding of Ca2+ calculated with profile likelihood method. EC50 values (asterisks) are shown with confidence intervals in square brackets below the graph.


