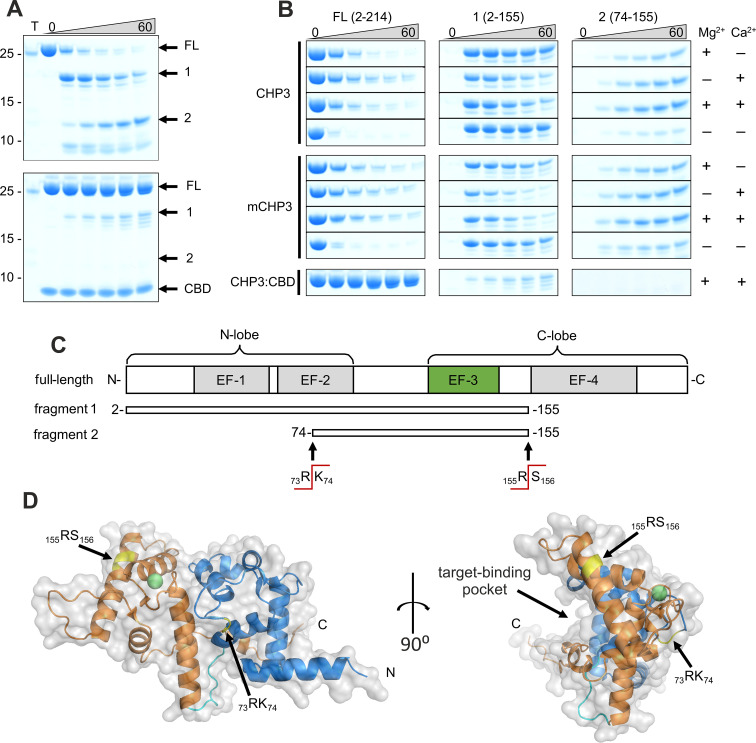
Figure 4. Ca2+-binding and complex formation change the accessibility of trypsin cleavage sites in CHP3 and mCHP3.
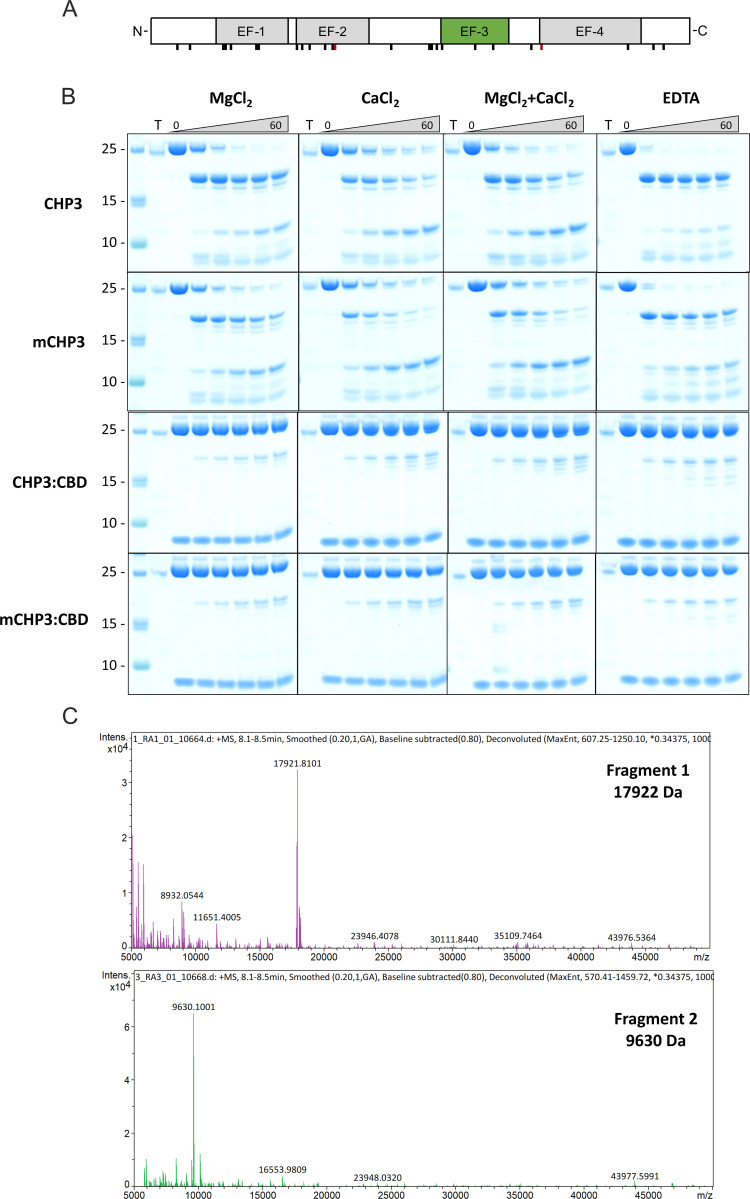
(A) Time-dependent (0–60 min) limited proteolysis (trypsin) of CHP3 (top) and the complex of CHP3:CBD (bottom) in the presence of both Mg2+ and Ca2+. Positions of full-length protein (FL) and two major proteolytic fragments (1 and 2) as well as CBD are indicated on the right of the Coomassie-stained SDS–PAGE gel, positions of co-separated molecular mass standards (mass in kDa) – on the left; the sample containing only trypsin was loaded on the first lane (T); Figure 4—source data 1: Full gels of (A). (B) Time-dependent limited proteolysis of CHP3 and mCHP3 in the presence of Mg2+, Ca2+, both ions or in the absence of them. Sections of the gel with bands corresponding to the full-length protein (FL) and two major proteolytic fragments (1 and 2) are shown. Nearly no degradation was observed for CHP3 and mCHP3 in the complex with CBD in all conditions (Mg2+ + Ca2+ condition is presented here, other gels are shown in Figure 4—figure supplement 1B and its source data). (C) Schematic representation of full-length CHP3 with indication of N- and C-lobes, four EF-hand motifs (active EF-3 is highlighted in green). Proteolytic fragments 1 and 2 and trypsin cleavage sites were identified by mass spectrometry. (D) Combined ribbon and surface presentation of the CHP3 AlphaFold2.0 model (Varadi et al., 2022) with N- and C-lobes shown in blue and orange, respectively, and the connecting CHP-loop in cyan; the two major trypsin cleavage sites are highlighted in yellow and Ca2+ ion as a green sphere. The Ca2+ position in EF-3 was modelled by superimposition of the CHP3 model with the CHP1 X-ray structure, pdb ID 2ct9 (Andrade et al., 2004).


