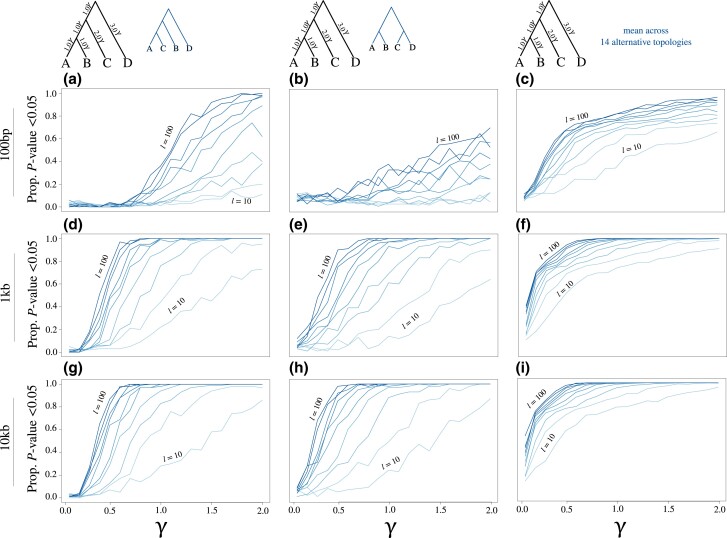
Fig. 11.
Estimated gene trees and statistical power of the SH* test. Results are shown for estimates of true positive rates (blue lines and trees) across a range of branch scaling values with gene trees estimated from simulated alignments comprising 100 bp (a–c), 1 kb (d–f), and 10 kb (g–i). Lines indicate the proportion of replicates with P ≤ 0.05, with colors ranging from light blue ( gene trees) to dark blue ( gene trees) in increments of 10 gene trees. The third column shows the fraction of replicates with P ≤ 0.05 averaged across all 14 alternative rooted topologies for four-species trees. See figure 5 caption for additional information regarding the parameter γ.

