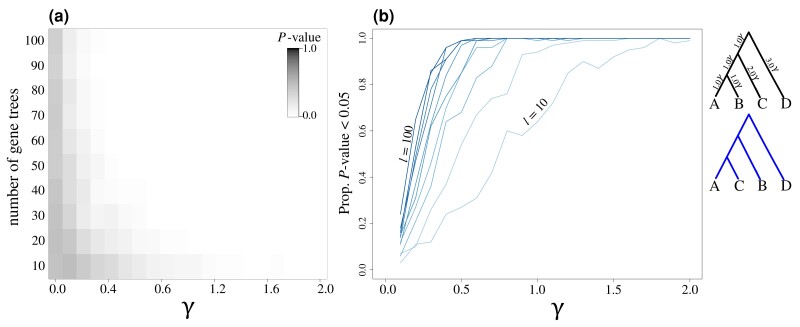
Fig. 13.
Exploring the impact of recombination on the statistical performance of the KH* test. Results are shown for the mean P value across replicates (a) and proportion of replicates with P ≤ 0.05 (b). For each set of conditions, gene trees within a recombining locus were simulated using the “true” (generating) species topology shown to the right in black, with the alternative topology shown in blue. Divergence times for the true topology were scaled by multiplying branches by a scaling factor . See Materials and Methods for our simulation protocol.

