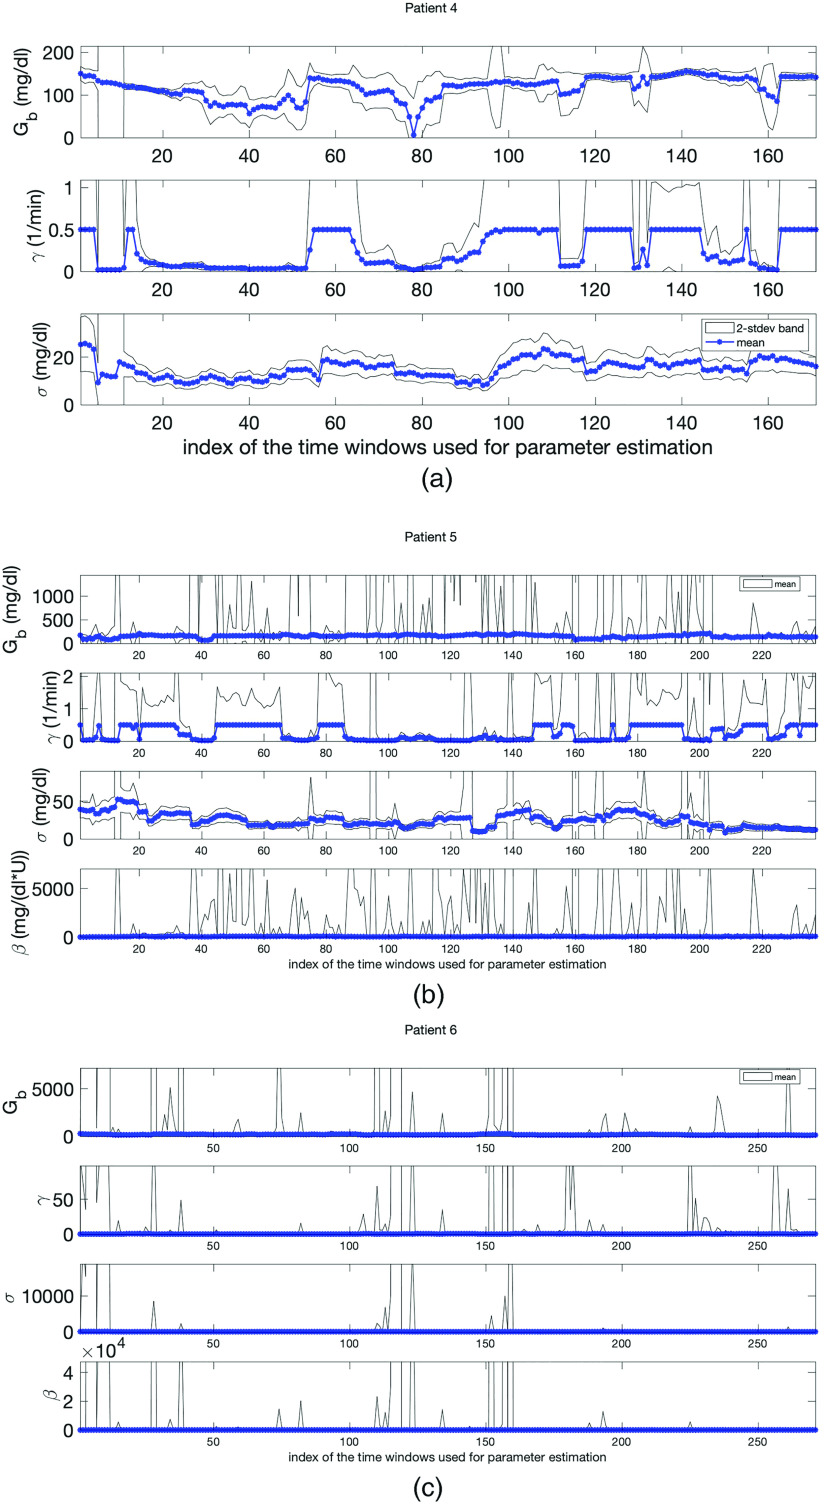
FIG. 10.
Panels (a)–(c) show the UQ bands when we use the optimization approach for parameter estimation in the ICU setting for patients 4, 5, and 6, respectively. The blue stars are the point estimates for the respective parameters and the gray region quantifies the uncertainty in the estimation. Because of the parameter identifiability issues, the Hessian matrix is ill-conditioned. When we compute its inverse to obtain the variance in the estimated model parameters, we obtain unreasonably wide UQ bands.

