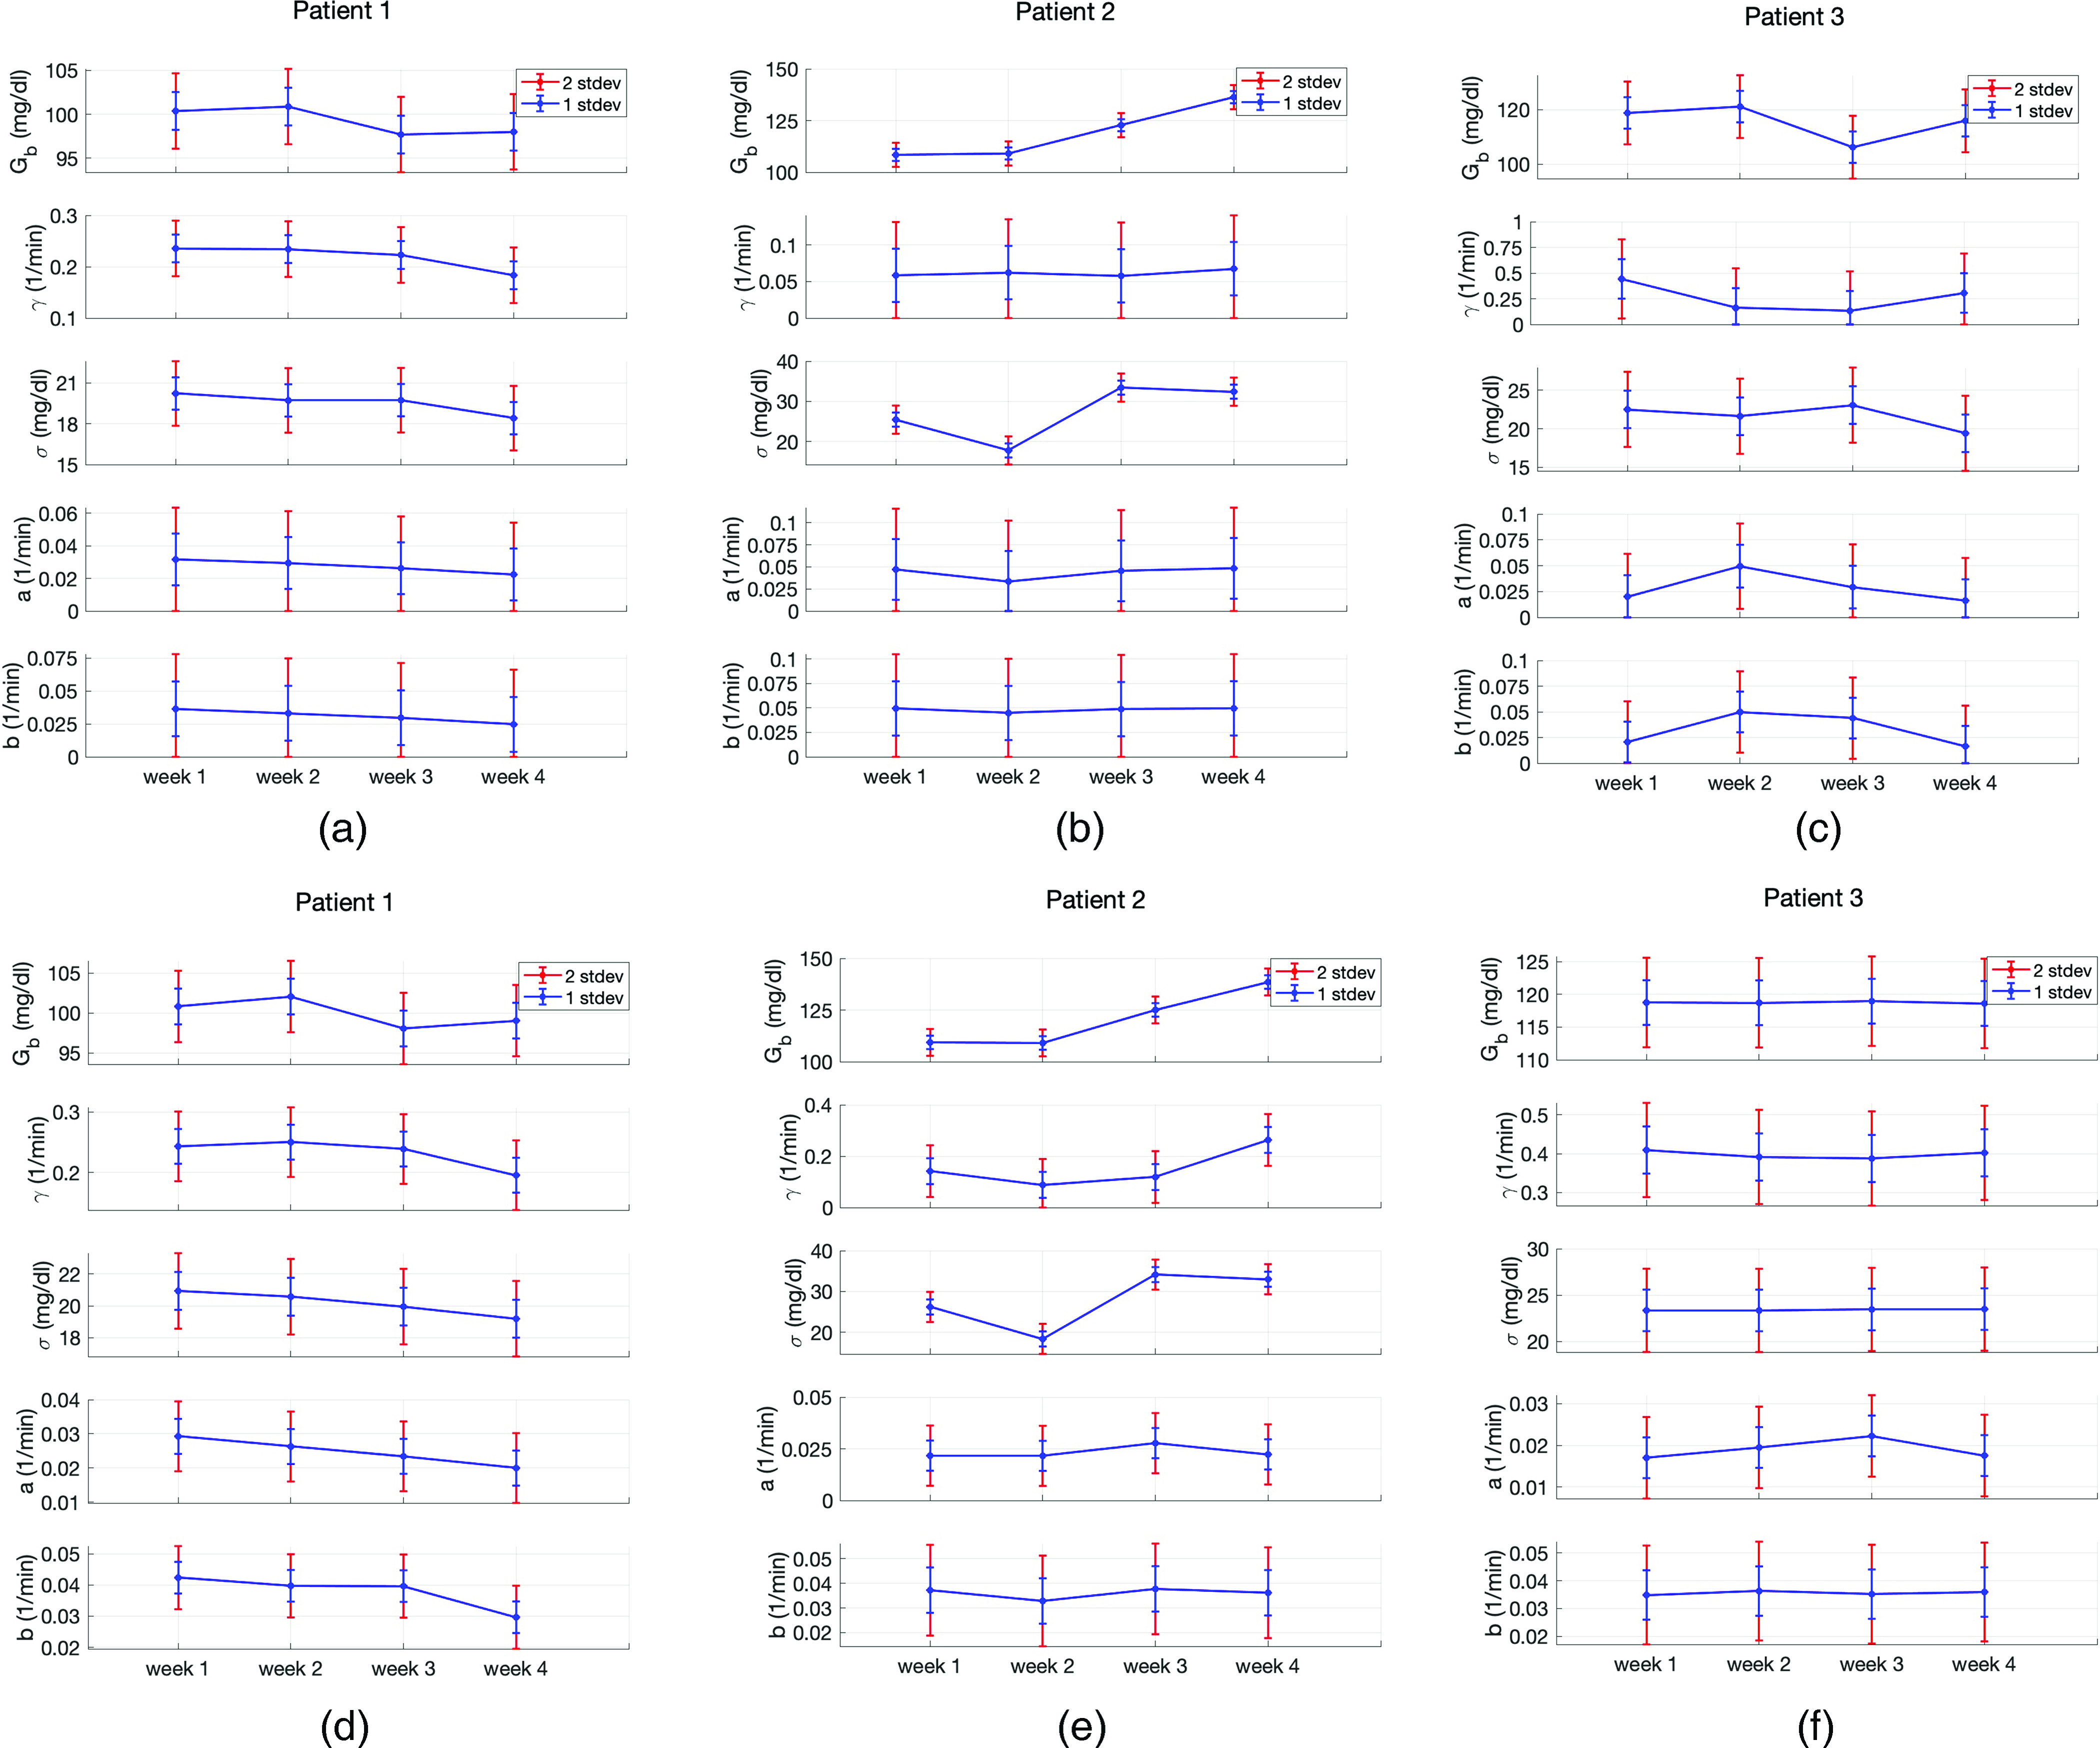
FIG. 3.

Parameter estimation and uncertainty quantification in the T2DM setting. Panels (a)–(c) show results obtained with optimization and panels (d)–(f) show results obtained with MCMC for patients 1, 2, and 3, respectively. Both approaches are used in a patient-specific manner. We see that the point estimates obtained with two approaches are very close to each other in most cases. Also the width of the 1- and 2-stdev intervals, which are obtained with Laplace approximation (optimization) and directly from the approximate posterior samples (MCMC), are also in agreement with each other. Here, these intervals quantify the uncertainty in the point-estimates of the parameters. The parameter estimates and agree with real physiological values and the non-stationary behavior of the glucose dynamics of T2DM patients is reflected in the time-evolving behavior of the estimated parameters. All these features enforce the reliability of the parameter estimation results.
