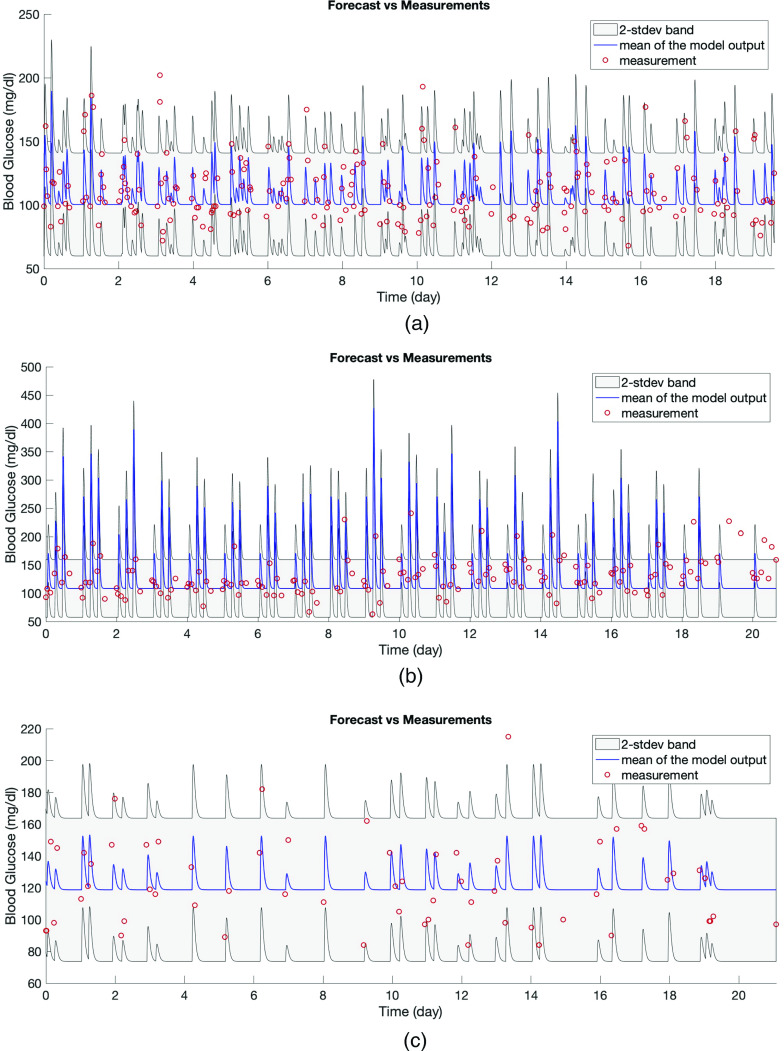
FIG. 5.
Panels (a)–(c) show forecasting results in the T2DM setting obtained via models formed by using the estimated parameters with the optimization approach for patients 1, 2, and 3, respectively. In each plot, the red circles show the true BG measurements, the blue curve shows the mean of the model output, and the gray region is the estimated 2-stdev band around the mean of the model output, quantifying possible low and high values of the forecasted BG levels. These forecasting results show that the proposed model mean, when equipped with confidence bands found from standard deviations, estimate the BG levels accurately, and in a patient specific way. This reinforces the claim that the model parameters could be used to provide information about the health condition of individual patients.

