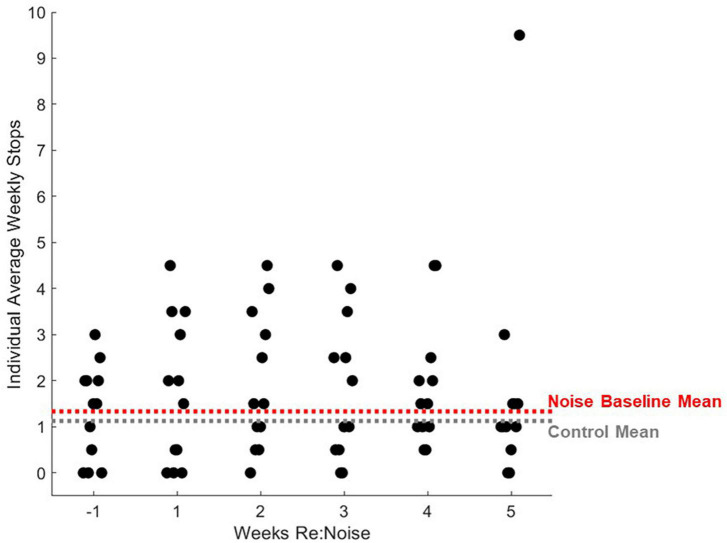
FIGURE 10.
Individual rats’ balance beam crossing stops. Stops during balance beam crossing were totaled for each experimental day and 2 days per experimental week were averaged for each noise exposed rat (n = 12). For comparison, mean control stops during balance beam crossing for weeks −1 to 5 are plotted as a horizontal gray dashed line and mean baseline (week −1) stops are plotted for noise-exposed rats. Mean non-noise exposed and baseline noise-exposed rats are similar. After noise exposure, the distribution of stops during balance beam crossing do not change significantly with the exception of one outlier data point.

