
FIGURE 5.
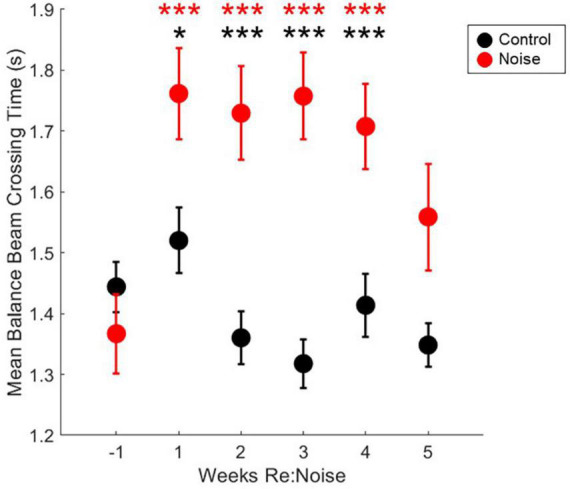
Crossing times are elevated after noise exposure. After noise exposure (red circles), mean balance beam crossing times are significantly elevated from baseline (red asterisks; n = 12; ***p < 0.001). Mean control balance beam crossing times (black circles) are not different from baseline at any timepoint (n = 8). At baseline, noise and control crossing times are not significantly different. However, during weeks 1–4, control and noise mean balance beam crossing times are significantly different (black asterisks; ***p < 0.001; *p < 0.05). Mean noise values are produced from a total of 240 individual data points per experimental week. Mean control values are produced from a total of 160 individual data points per experimental week. Mean values are plotted with standard error of the mean (SEM).