
FIGURE 7.
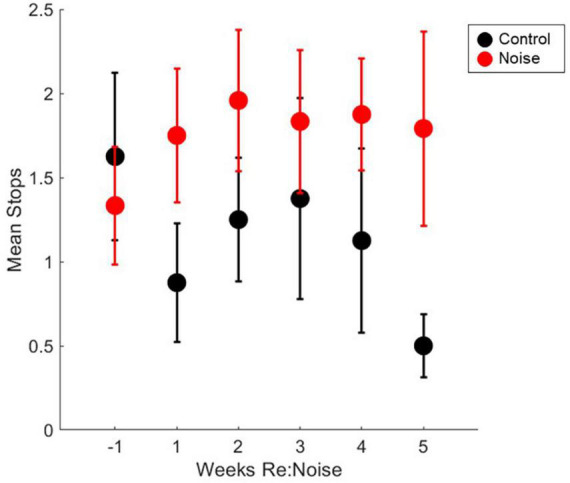
Number of stops during balance beam crosses are not significantly affected by noise exposure stops in control (black circles, n = 8) and noise-exposed (red circles, n = 12) groups are not significantly elevated from baseline (n = 12). Mean noise values are produced from a total of 240 individual data points per experimental week. Mean control values are produced from a total of 160 individual data points per experimental week. Mean values are plotted with standard error of the mean (SEM).