
Figure 4.
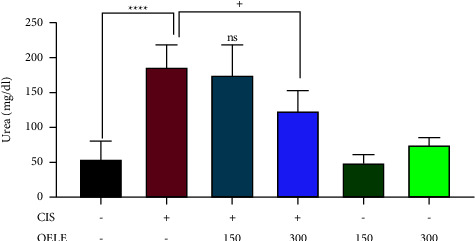
Changes in urea levels on day 15 of the experiment. Notes: each bar is expressed as mean ± SEM. Cisplatin vs. control group: ∗∗∗∗P < 0.0001; CIS vs. (CIS/OELE-150 and CIS/OELE-300): +P < 0.05. CIS: cisplatin; OELE: Olea europaea leaf extract; ns: nonsignificant; n = 5 rats/group.