
Figure 7.
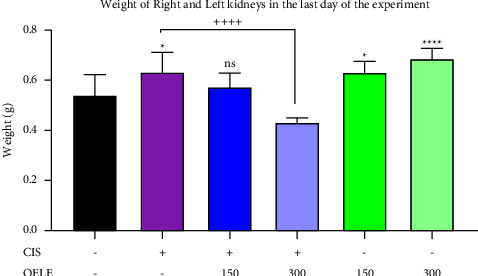
Weight of the right and left kidneys of the rats at the end of the experiment. Notes: each bar is expressed as mean ± SEM. Cisplatin vs. control group: ∗∗∗∗P < 0.001 and ∗P < 0.05; CIS vs. (CIS/OELE-150 and CIS/OELE-300): ++++P < 0.001. CIS: cisplatin; OELE: Olea europaea leaf extract; ns: nonsignificant; n = 5 rats/group.