
Figure 3.
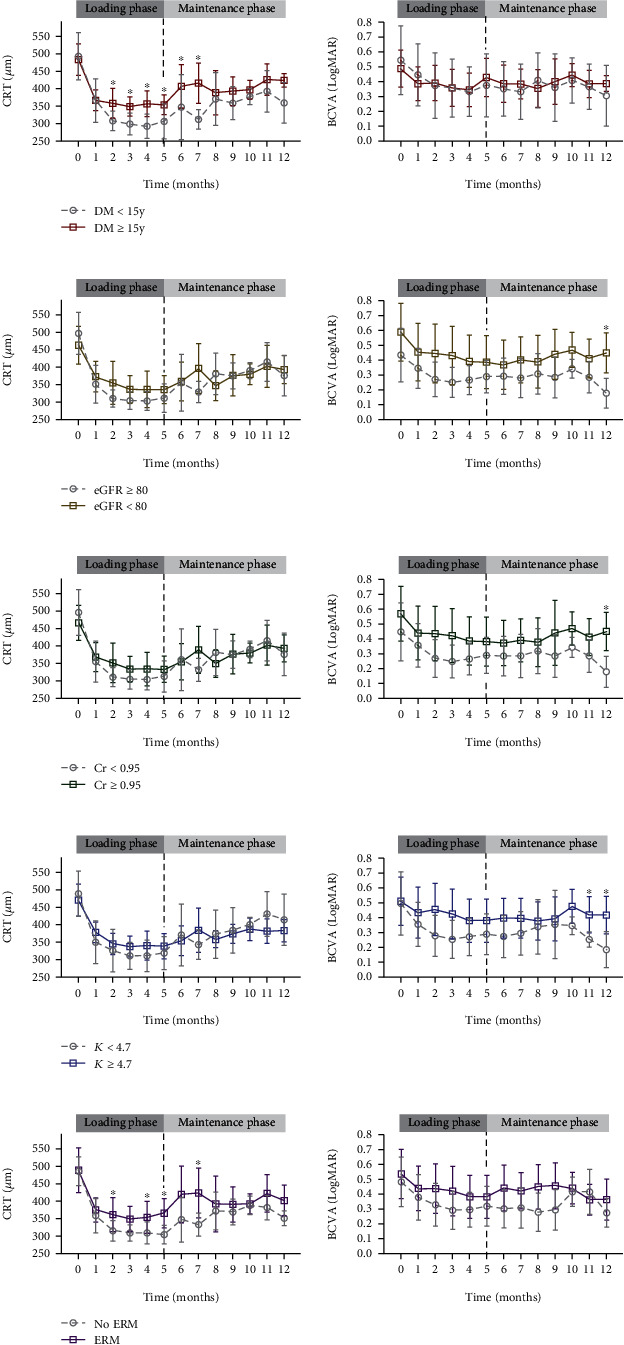
Mean changes in central retinal thickness and best-corrected visual acuity according to systemic and ocular risk factors for suboptimal treatment response. Mean changes in central retinal thickness (CRT, left) and best-corrected visual acuity (BCVA, right) during the loading phase (months 0-4) and maintenance phase (PRN regimen, months 5-12) with 95% confidence interval error bars in (a) diabetic mellitus (DM) duration ≥ 15 years (red solid line) vs. <15 years (gray dotted line); (b) estimated glomerular filtration rate (eGFR) < 80 mL/min/1.73 m2 (brown solid line) vs. ≥80 mL/min/1.73 m2 (gray dotted line); (c) serum creatinine (Cr) ≥ 0.95 mg/dL (green solid line) vs. <0.95 mg/dL (gray dotted line); (d) potassium (K) ≥ 4.7 mmol/L (blue solid line) vs. <4.7 mmol/L (gray dotted line); and (e) presence of epiretinal membrane (ERM, purple solid line) vs. absence of ERM (gray dotted line). For month five, the result of the five monthly loading aflibercept injections is indicated by the vertical black dotted line (∗significant difference between groups in Mann–Whitney U-test, p < 0.05).