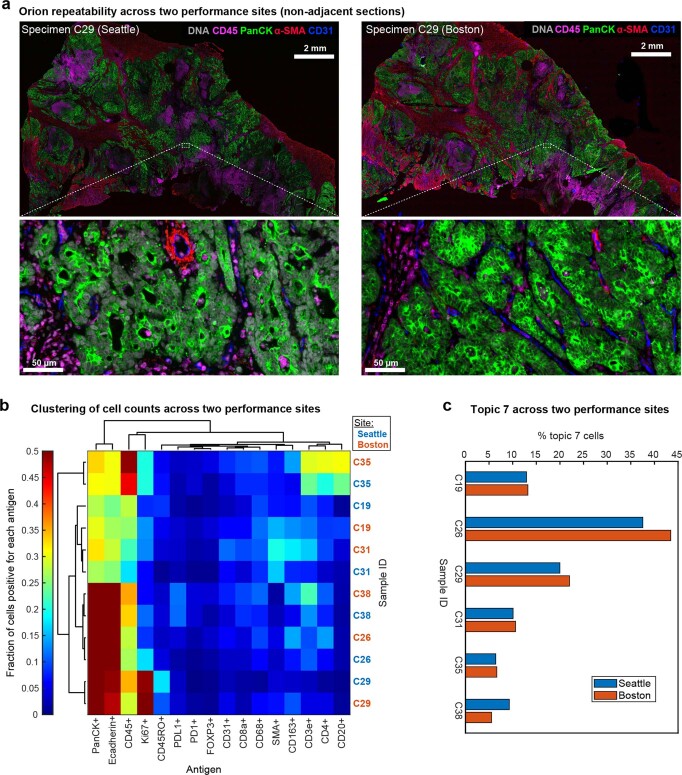
Extended Data Fig. 4. Evaluation of Orion data collected at two performance sites.
a, Orion images of two adjacent sections acquired in two different laboratories. Specimen on the left was imaged at RareCyte, Inc in Seattle, WA and specimen on the right at HMS in Boston, MA. DNA (Sytox), CD45, pan-cytokeratin, α-SMA, and CD31 are shown. Scalebars 2 mm and 50 µm, as indicated. Images are from one representative sample (C29). b, Two-way hierarchical clustering heat map for the indicated markers and samples imaged at RareCyte (C19, C26, C29, C31, C35, C38) or at HMS (C19new, C26new, C29new, C31new, C35new, C38new) with the fraction of positive cells mapped to color. c, Bar plots showing the percentage of Topic 7 present in the indicated samples (C19, C26, C29, C31, C35, C38) imaged at two performance sites.

