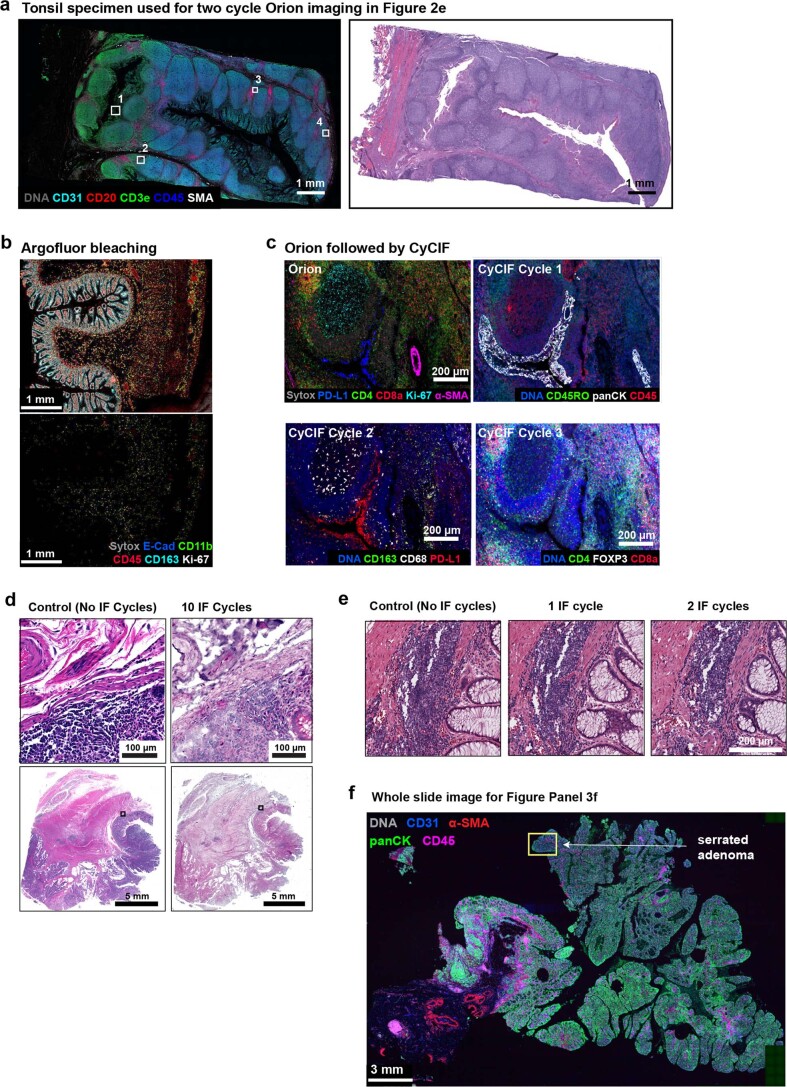
Extended Data Fig. 5. Immunofluorescence and H&E images following multiple cycles of Orion imaging.
a, Left panel: Orion image of FFPE tonsil showing DNA (Sytox), CD31, CD20, CD3e, CD45 and α-SMA). Scalebars 1 mm. ROIs 1 to 4 displayed in Fig. 2e are noted. Scalebar 50 µm. Right panel: H&E image after two cycle Orion imaging (that is, after imaging of one panel, inactivation, and imaging of a second panel). Scalebars 1 mm. b, Top panel: Orion image of normal colon showing E-cadherin, CD11b, CD45, CD163, Ki-67, and DNA (Sytox) signal. Lower panel: same area of normal colon following inactivation of Orion fluorophores (see Methods). c, Same-slide Orion and CyCIF experiment. The tonsil samples were first processed with 16 Orion antibodies; PD-L1, CD4, CD8a, Ki-67, and α-SMA are shown. After imaging, fluorophores were inactivated by bleaching using the standard CyCIF protocol, then three-cycles of four-channel CyCIF staining and imaging were performed using the indicated antibodies. d, Images of H&E-stained sections of colorectal cancer without prior IF staining (right) and following 10 cycles of IF (left) using the standard CyCIF approach. Area shown in insets is indicated in the low magnification images. Scalebars 5 mm and 100 µm. e, Images of H&E-stained sections of colorectal cancer performed before IF imaging (0 cycles), after one cycle of IF imaging (1 IF cycle), and after two cycles of IF imaging (2 IF cycles). Scalebars 200 µm. f, Orion IF image from colorectal cancer resection, showing an area of serrated adenoma with low pan-cytokeratin expression (markers as indicated). Higher magnification inset as indicated by the box is shown in Fig. 3f. Scalebar 3 mm. Images are from one specimen (C26).

