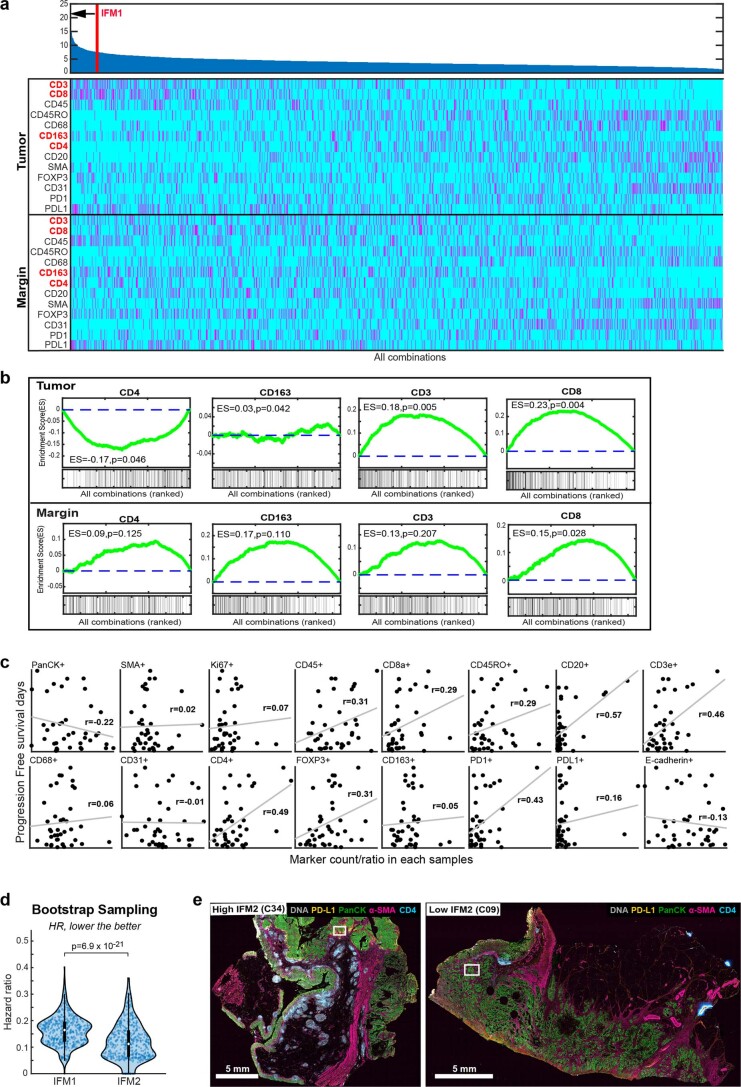
Extended Data Fig. 6. Assessment of individual markers in Image Feature Models of patient prognosis derived from Orion immunofluorescence images.
a, Upper: Ranking of 1/hazard ratio (HR) for each Image Feature Model (IFM1 to IFM14,950) calculated by determining the positive cell frequency for one or more of 13 markers, lying within (tumor center: CT) or outside of a region 100 µm from the tumor invasive margin (IM) model (N = 40 patients). Ranking of IFM1 is indicated. IFM2 showed an HR = 0.08 (95% CI: 0.04–0.17, p = 1.91 × 10−06). Lower: Heat map showing the selected markers at the tumor or margin in each combination. 14,950 total combinations were generated as the set of 4 out of 26 parameters (13 markers in 2 regions). b, Enrichment plots showing enrichment scores (ES) for positive cells per indicated marker (and their location in the tumor or at the tumor margin) based on the 16-plex Orion images, indicating whether the marker/location feature is enriched in the IFMs linked to the best hazard ratios. The green lines represent the running ES for a given marker/location as the analysis proceeds down the ranked list. The value at the peak is the final ES. The Kolmogorov-Smirnov test was used to calculate the ES and p-values (N = 40 patients). c, Regression line scatter plot showing fraction of positive cells for indicated markers from the Orion 16-plex images vs. progression-free survival (PFS, days) for 40 patients with CRC. Each dot represents measurements from a single patient. r per plot is displayed. d, Plot bootstrapping HRs from IFM1 and IFM2 (unadjusted p = 4.62 × 10⁻²⁶ and adjusted p = 6.9 × 10⁻²¹). Related to Fig. 5b. Detailed analysis is described in Methods. Pairwise two-tailed t-tests were used unless otherwise mentioned. Box and whisker represents N = 500 (random sampling), where midline = median, box limits = Q1 (25th percentile)/Q3 (75th percentile), whiskers = 1.5 inter-quartile range (IQR), and dots = outliers (>1.5IQR). e, Representative Orion IF images of cases with high IFM2 (IS = 4 in specimen C34) and low IFM2 (IS = 0 in specimen C09). Scalebars 5 mm. Higher magnification regions of interest shown in Fig. 5d. Images are from 2 representative patients/samples.

