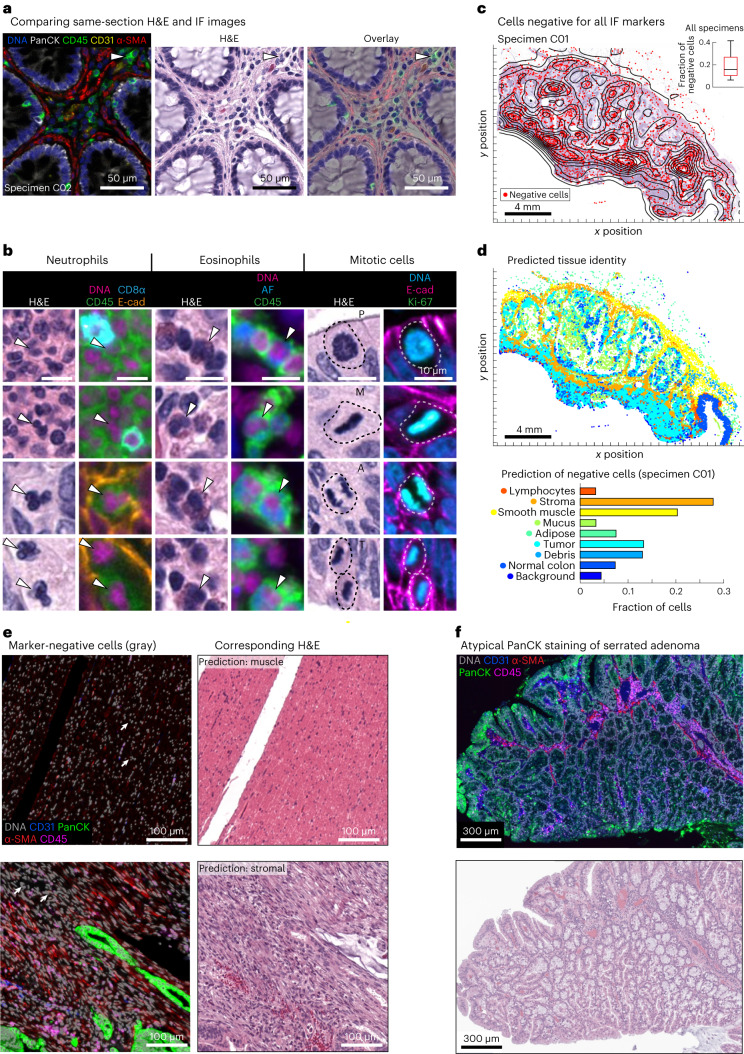
Fig. 3. Combined H&E and Orion to identify cell and tissue types.
a, Representative images of Orion IF and same-section H&E. All images are from one representative colorectal specimen (C02). b, Cell types not specifically identified by markers in the Orion panel but readily recognized in H&E images, including neutrophils, eosinophils and cells undergoing mitoses (selected cells of each type are denoted by arrowheads and dashed lines). Images are from three different representative colorectal specimens/sections (columns 1 and 2 are from C27/C04, columns 3 and 4 are from C04, and columns 5 and 6 are from C03); E-cad, E-cadherin; AF, autofluorescence; P, prophase; M, metaphase; A, anaphase; T, telophase. c, Spatial maps of the positions of cells (~15% of total cells) that were not detected by the Orion IF panel in a CRC specimen overlaid onto the corresponding H&E image (specimen C01); dots denote cells with identifiable nuclei but not subtyped using the antibody panel. Box and whisker plots show unidentifiable cells in cohort 1 (N = 40 specimens, C01–C40), the midline indicates the median, box limits indicate quartile 1 (25th percentile)/quartile 3 (75th percentile), and whiskers indicate 1.5× interquartile range (IQR). d, Top, spatial map of nine tissue classes determined from the H&E image using a CNN model for various cell types as indicated36. Bottom, percentage of the total number of ‘unidentifiable’ (negative) cells assigned to a specific tissue class by the CNN applied to the H&E image. Data were derived from N = 1 representative specimen (C01). e, Example same-section Orion IF and H&E images from areas enriched for ‘non-detected’ cells; examples include areas predicted to be rich in stroma and smooth muscle. f, Orion IF and H&E images showing an area of serrated adenoma with low pan-cytokeratin expression (markers are as indicated). Whole-slide image indicating the location of this region is shown in Extended Data Fig. 5f. Images are from one colorectal specimen (C26).

