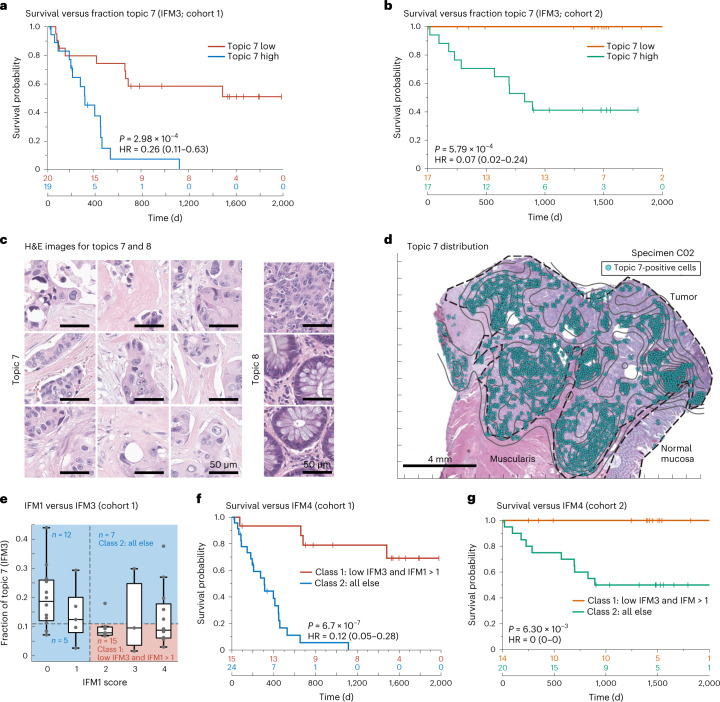
Fig. 7. LDA topic 7 corresponds to aggressive tumor regions and is correlated with poor outcomes.
a,b, Kaplan–Meier plots of PFS based on the fraction of topic 7 present in the tumor domain and stratified as ‘high’ when above the median (50th percentile) and ‘low’ when below the median of all cases (HR, 95% CI and log-rank P value) for 40 individuals with CRC in cohort 1 (a) and 34 individuals with CRC in cohort 2 (b). c, Representative H&E images of topic 7 (left) and topic 8 (right) extracted from all specimens using a CNN (GoogLeNet) trained on LDA data. Images were derived from 10 participants/specimens (C01–C10). d, Spatial map of LDA topic 7 and H&E image for one representative specimen (C02). e, Plot of fraction of topic 7 (IFM3) versus IFM1 score for 40 individuals with CRC. The midline indicates the median, box limits indicate quartile 1 (25th percentile)/quartile 3 (75th percentile), whiskers indicate 1.5× IQR, and dots indicate outliers (>1.5× IQR). f,g, Kaplan–Meier plots stratified using IFM4, which was binarized as follows: class 1, IFM1 high and topic 7 (IFM3) low group; class 2, all other participants (that is, either low IFM1 and/or high topic 7 (IFM3); HR, 95% CI and log-rank P value) for cohort 1(40 individuals with CRC; g) and cohort 2 (34 individuals with CRC; h).

