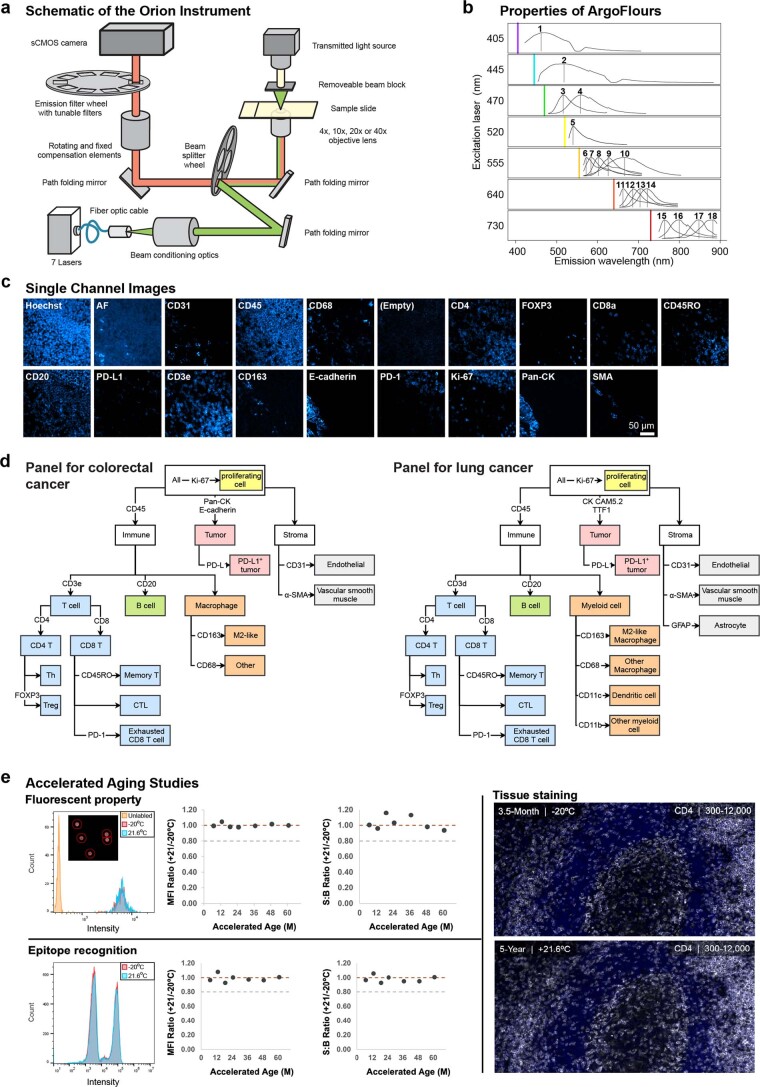
Extended Data Fig. 1. Features of the fluorophores, signal extraction, antibodies, cell type calling, and instrumentation used in the Orion™ Method.
a, Schematic of the Orion optical system. The Orion imaging system has fluorescence and brightfield imaging modes. Fluorescence imaging: A 7-color, class 1 laser was used to illuminate a sample slide. Emission light from the sample is redirected through a tunable emission filter prior to collection by a sCMOS camera. Brightfield imaging: The Orion system utilizes LED transillumination of the microscope slide sample. Transmitted light follows the same path as the fluorescence emission, with the exception that a window is used instead of an emission filter. b, Emission spectra of the ArgoFluor dyes with overlaid filter profiles. Each row shows fluorophores excited using the same laser (denoted by the colored vertical line). See Supplementary Table 2 for excitation laser wavelengths and fluorophores in channel 1 through 18. The 405-laser data was collected from tonsil tissue stained with Hoechst 33342; 445-laser data from unstained lung tissue. All other data was collected from single color Ig-capture beads (generated by incubation with antibodies conjugated to the indicated ArgoFluor dye). Per sample, data was collected in multiple Orion channels, spanning a wide range of wavelengths (in 2 nm center wavelength increments). c, Single channel images of FFPE tonsil section stained, imaged, and processed with Orion showing distinct spatial patterns and minimal channel crosstalk. d, Cell type calling dendrograms for Orion image analysis for colorectal cancer (left) and lung cancer (right). e, Stability of ArgoFluor 572 conjugated anti-CD4 antibody. Reagents were stored at an accelerated aging condition (21.6 °C) or the recommended condition (−20 °C). Storage for 3.5 months at 21.6 °C is equivalent to 5 years at −20 °C based on the Arrhenius equation. Fluorochrome property: The intensity of Ig-capture beads incubated with (signal) or without (background) antibody was measured from Orion images. The histogram overlay shows the intensity distribution for beads that were unlabeled or incubated with antibody and stored for 3.5 months at −20 °C or 21.6 °C. The mean fluorescence intensity (MFI) and the MFI signal-to-background (S:B) ratios were obtained across 7 time points. Epitope recognition: Human peripheral blood mononuclear cells (PBMC) were stained with accelerated-aged or real-time-aged ArgoFluor 572 conjugated anti-CD4 antibody and analyzed using flow cytometry. The MFI was obtained for the positive and negative populations to derive S:B ratios. Tissue staining: Orion images of serial sections from FFPE tonsil stained with real-time aged (top) and accelerated-aged (bottom) antibodies. These methods demonstrate equivalent performance for both storage conditions in the three assays.

