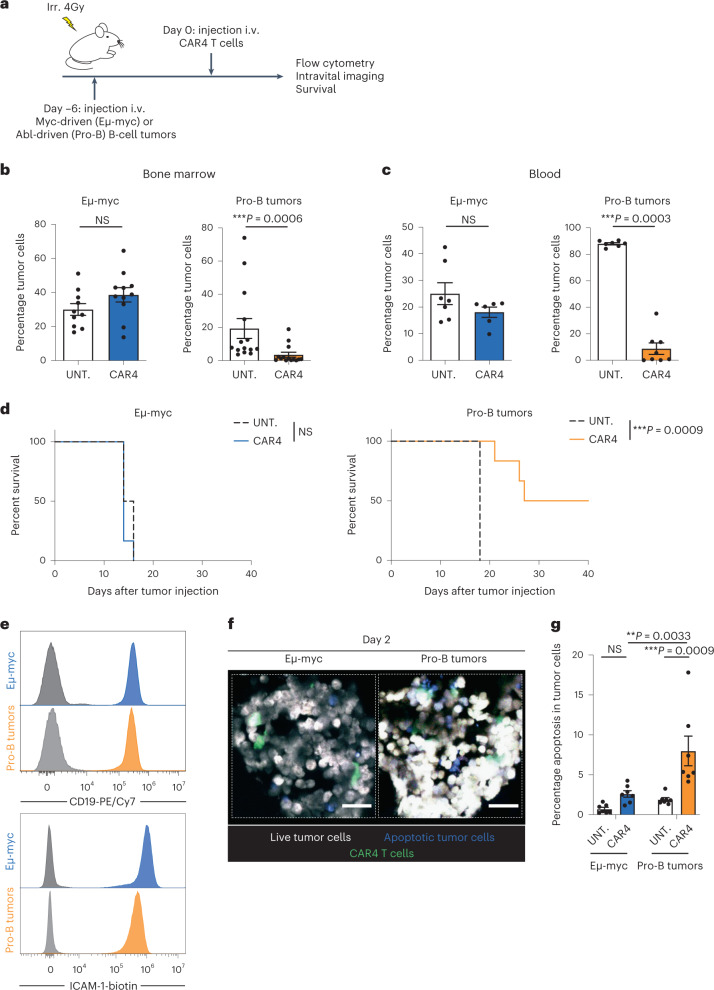
Fig. 1. Distinct B-cell tumors exhibit differential sensitivities to CAR4 T-cell therapy.
a, In vivo experimental setup. B-cell tumors were established by intravenous (i.v.) injection of 0.5 × 10⁶ Eμ-myc or pro-B-cell tumors expressing the FRET-based caspase 3 reporter in C57BL/6 mice after sublethal irradiation. Six days later, mice were injected intravenously with CAR4 T cells. b, Percentage of tumor cells recovered from the bone marrow 3 d after CAR4 T-cell transfer. Data are compiled from n = 3 (Eµ-myc, n = 10 untreated and n = 11 CAR4 T-cell-treated mice) or n = 4 (pro-B tumors, n = 14 untreated and n = 14 CAR4 T-cell-treated mice) independent experiments. Each dot represents one mouse. Two-tailed Mann–Whitney U-tests were used for statistical analysis. c, Percentage of tumor cells detected in the blood 7 d after CAR4 T-cell transfer. Representative of n = 2 independent experiments (for Eµ-myc, n = 7 untreated and n = 6 CAR4 T-cell-treated mice; for pro-B tumors, n = 7 untreated and n = 8 CAR4 T-cell-treated mice). Each dot represents one mouse. Two-tailed Mann–Whitney U-tests were used for statistical analysis. d, CAR4 T-cell therapy prolonged the survival of pro-B tumor- but not Eµ-myc tumor-bearing mice. Log-rank test was used for statistical analysis (n = 6 mice per group). Representative of n = 2 (Eµ-myc) or n = 4 (pro-B tumors) independent experiments. e, CD19 and ICAM-1 (CD54) expression on Eµ-myc and pro-B-cell tumors. Gray histograms represent the unstained control. f, Representative two-photon images of the bone marrow of tumor-bearing mice treated with CAR4 T cells 2 d earlier. CAR4 T cells are shown in green, live tumor cells in white, and apoptotic tumor cells in blue. Scale bars, 30 µm. Representative of n = 2 independent experiments. g, Bone marrow composition was analyzed ex vivo by flow cytometry 3 d after CAR4 T-cell transfer. Summary graphs showing the percentage of apoptotic tumor cells. Data are compiled from n = 2 independent experiments (n = 7 mice per group). Each dot represents one mouse. Two-way analysis of variance (ANOVA) and Tukey’s multiple comparisons were used for statistical analysis. Data are expressed as mean ± s.e.m. ***P < 0.001; **P < 0.01; NS, not significant.

